Yakama vs Albanian Unemployment Among Ages 16 to 19 years
COMPARE
Yakama
Albanian
Unemployment Among Ages 16 to 19 years
Unemployment Among Ages 16 to 19 years Comparison
Yakama
Albanians
22.5%
UNEMPLOYMENT AMONG AGES 16 TO 19 YEARS
0.0/ 100
METRIC RATING
323rd/ 347
METRIC RANK
18.2%
UNEMPLOYMENT AMONG AGES 16 TO 19 YEARS
5.8/ 100
METRIC RATING
229th/ 347
METRIC RANK
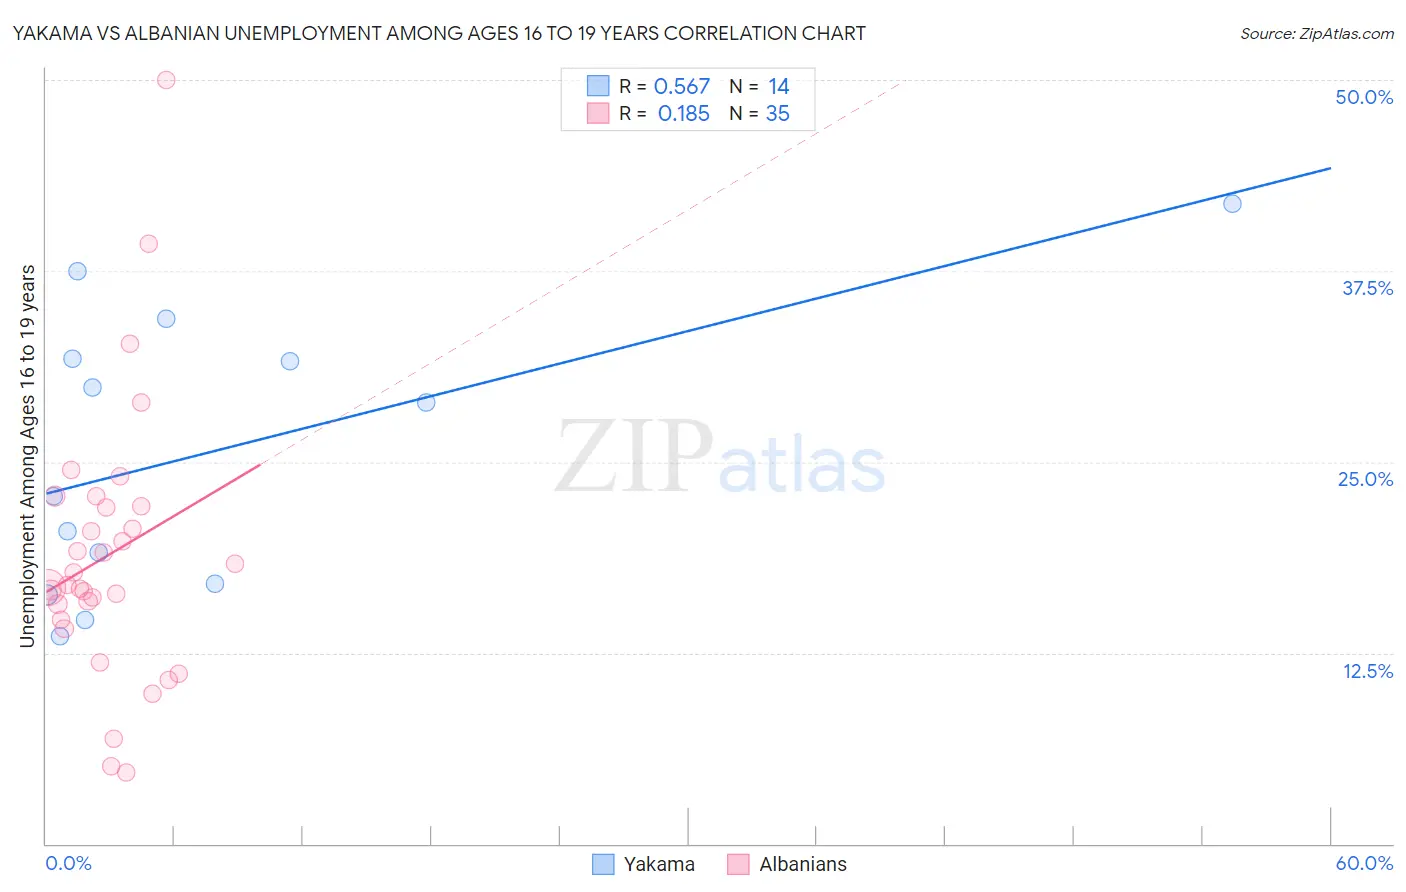
Yakama vs Albanian Unemployment Among Ages 16 to 19 years Correlation Chart
The statistical analysis conducted on geographies consisting of 19,533,677 people shows a substantial positive correlation between the proportion of Yakama and unemployment rate among population between the ages 16 and 19 in the United States with a correlation coefficient (R) of 0.567 and weighted average of 22.5%. Similarly, the statistical analysis conducted on geographies consisting of 186,358,251 people shows a poor positive correlation between the proportion of Albanians and unemployment rate among population between the ages 16 and 19 in the United States with a correlation coefficient (R) of 0.185 and weighted average of 18.2%, a difference of 24.0%.
Unemployment Among Ages 16 to 19 years Correlation Summary
| Measurement | Yakama | Albanian |
| Minimum | 13.6% | 4.7% |
| Maximum | 41.9% | 50.0% |
| Range | 28.3% | 45.3% |
| Mean | 25.7% | 18.9% |
| Median | 25.8% | 16.9% |
| Interquartile 25% (IQ1) | 17.0% | 14.7% |
| Interquartile 75% (IQ3) | 31.8% | 22.1% |
| Interquartile Range (IQR) | 14.8% | 7.4% |
| Standard Deviation (Sample) | 9.2% | 8.9% |
| Standard Deviation (Population) | 8.8% | 8.8% |
Similar Demographics by Unemployment Among Ages 16 to 19 years
Demographics Similar to Yakama by Unemployment Among Ages 16 to 19 years
In terms of unemployment among ages 16 to 19 years, the demographic groups most similar to Yakama are Barbadian (22.5%, a difference of 0.22%), West Indian (22.4%, a difference of 0.36%), Immigrants from Armenia (22.6%, a difference of 0.45%), Trinidadian and Tobagonian (22.6%, a difference of 0.57%), and Cheyenne (22.3%, a difference of 1.1%).
| Demographics | Rating | Rank | Unemployment Among Ages 16 to 19 years |
| Tohono O'odham | 0.0 /100 | #316 | Tragic 22.1% |
| Immigrants | Belize | 0.0 /100 | #317 | Tragic 22.2% |
| Immigrants | Jamaica | 0.0 /100 | #318 | Tragic 22.2% |
| Immigrants | West Indies | 0.0 /100 | #319 | Tragic 22.2% |
| Cheyenne | 0.0 /100 | #320 | Tragic 22.3% |
| West Indians | 0.0 /100 | #321 | Tragic 22.4% |
| Barbadians | 0.0 /100 | #322 | Tragic 22.5% |
| Yakama | 0.0 /100 | #323 | Tragic 22.5% |
| Immigrants | Armenia | 0.0 /100 | #324 | Tragic 22.6% |
| Trinidadians and Tobagonians | 0.0 /100 | #325 | Tragic 22.6% |
| Immigrants | Trinidad and Tobago | 0.0 /100 | #326 | Tragic 23.1% |
| Pima | 0.0 /100 | #327 | Tragic 23.1% |
| Immigrants | Dominican Republic | 0.0 /100 | #328 | Tragic 23.3% |
| Tlingit-Haida | 0.0 /100 | #329 | Tragic 23.5% |
| Dominicans | 0.0 /100 | #330 | Tragic 23.6% |
Demographics Similar to Albanians by Unemployment Among Ages 16 to 19 years
In terms of unemployment among ages 16 to 19 years, the demographic groups most similar to Albanians are Immigrants from Greece (18.1%, a difference of 0.25%), Immigrants from Liberia (18.1%, a difference of 0.26%), Spanish American (18.2%, a difference of 0.26%), Immigrants from Belgium (18.1%, a difference of 0.28%), and Immigrants from Chile (18.1%, a difference of 0.32%).
| Demographics | Rating | Rank | Unemployment Among Ages 16 to 19 years |
| Immigrants | Iran | 10.7 /100 | #222 | Poor 18.0% |
| Immigrants | Western Asia | 10.2 /100 | #223 | Poor 18.0% |
| Immigrants | Serbia | 8.3 /100 | #224 | Tragic 18.1% |
| Immigrants | Chile | 7.5 /100 | #225 | Tragic 18.1% |
| Immigrants | Belgium | 7.3 /100 | #226 | Tragic 18.1% |
| Immigrants | Liberia | 7.1 /100 | #227 | Tragic 18.1% |
| Immigrants | Greece | 7.1 /100 | #228 | Tragic 18.1% |
| Albanians | 5.8 /100 | #229 | Tragic 18.2% |
| Spanish Americans | 4.7 /100 | #230 | Tragic 18.2% |
| Nepalese | 4.2 /100 | #231 | Tragic 18.2% |
| Immigrants | Russia | 4.0 /100 | #232 | Tragic 18.2% |
| Seminole | 4.0 /100 | #233 | Tragic 18.2% |
| Colombians | 3.7 /100 | #234 | Tragic 18.3% |
| French American Indians | 2.9 /100 | #235 | Tragic 18.3% |
| Immigrants | Colombia | 2.7 /100 | #236 | Tragic 18.3% |