Yakama vs Paraguayan Average Family Size
COMPARE
Yakama
Paraguayan
Average Family Size
Average Family Size Comparison
Yakama
Paraguayans
3.45
AVERAGE FAMILY SIZE
100.0/ 100
METRIC RATING
25th/ 347
METRIC RANK
3.20
AVERAGE FAMILY SIZE
16.3/ 100
METRIC RATING
205th/ 347
METRIC RANK
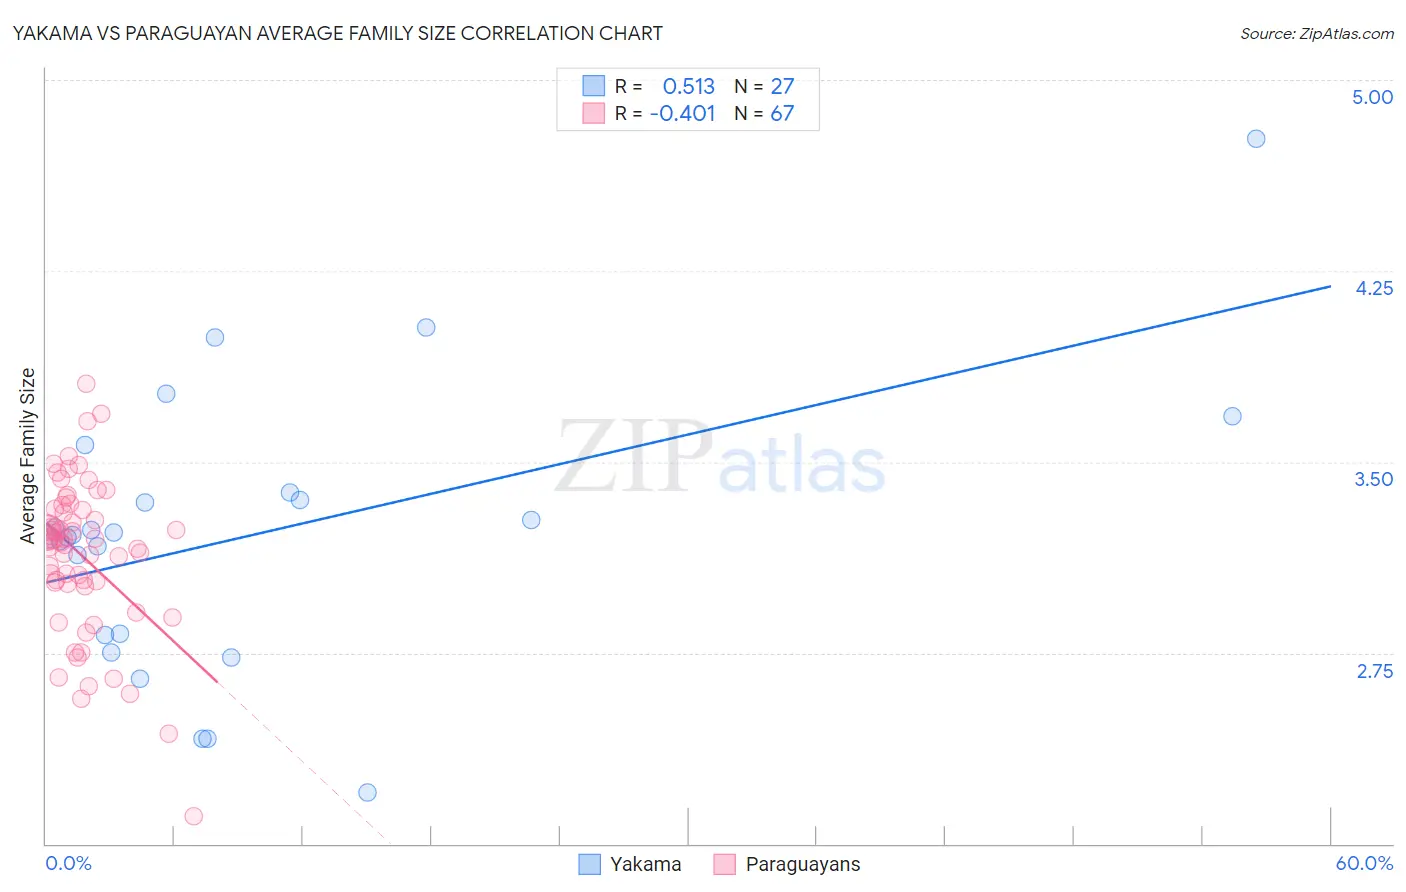
Yakama vs Paraguayan Average Family Size Correlation Chart
The statistical analysis conducted on geographies consisting of 19,917,879 people shows a substantial positive correlation between the proportion of Yakama and average family size in the United States with a correlation coefficient (R) of 0.513 and weighted average of 3.45. Similarly, the statistical analysis conducted on geographies consisting of 95,095,397 people shows a moderate negative correlation between the proportion of Paraguayans and average family size in the United States with a correlation coefficient (R) of -0.401 and weighted average of 3.20, a difference of 7.5%.
Average Family Size Correlation Summary
| Measurement | Yakama | Paraguayan |
| Minimum | 2.20 | 2.11 |
| Maximum | 4.77 | 3.80 |
| Range | 2.57 | 1.69 |
| Mean | 3.21 | 3.13 |
| Median | 3.21 | 3.19 |
| Interquartile 25% (IQ1) | 2.82 | 3.02 |
| Interquartile 75% (IQ3) | 3.38 | 3.32 |
| Interquartile Range (IQR) | 0.56 | 0.29 |
| Standard Deviation (Sample) | 0.55 | 0.31 |
| Standard Deviation (Population) | 0.54 | 0.30 |
Similar Demographics by Average Family Size
Demographics Similar to Yakama by Average Family Size
In terms of average family size, the demographic groups most similar to Yakama are Native/Alaskan (3.45, a difference of 0.11%), Immigrants from Fiji (3.45, a difference of 0.23%), Native Hawaiian (3.43, a difference of 0.51%), Apache (3.46, a difference of 0.52%), and Mexican American Indian (3.43, a difference of 0.52%).
| Demographics | Rating | Rank | Average Family Size |
| Salvadorans | 100.0 /100 | #18 | Exceptional 3.48 |
| Mexicans | 100.0 /100 | #19 | Exceptional 3.48 |
| Cheyenne | 100.0 /100 | #20 | Exceptional 3.47 |
| Yuman | 100.0 /100 | #21 | Exceptional 3.47 |
| Apache | 100.0 /100 | #22 | Exceptional 3.46 |
| Immigrants | Fiji | 100.0 /100 | #23 | Exceptional 3.45 |
| Natives/Alaskans | 100.0 /100 | #24 | Exceptional 3.45 |
| Yakama | 100.0 /100 | #25 | Exceptional 3.45 |
| Native Hawaiians | 100.0 /100 | #26 | Exceptional 3.43 |
| Mexican American Indians | 100.0 /100 | #27 | Exceptional 3.43 |
| Immigrants | Latin America | 100.0 /100 | #28 | Exceptional 3.42 |
| Nepalese | 100.0 /100 | #29 | Exceptional 3.42 |
| Samoans | 100.0 /100 | #30 | Exceptional 3.42 |
| Central Americans | 100.0 /100 | #31 | Exceptional 3.41 |
| Immigrants | Guatemala | 100.0 /100 | #32 | Exceptional 3.41 |
Demographics Similar to Paraguayans by Average Family Size
In terms of average family size, the demographic groups most similar to Paraguayans are Immigrants from Poland (3.20, a difference of 0.010%), Immigrants from Cabo Verde (3.20, a difference of 0.010%), Immigrants from Nepal (3.21, a difference of 0.060%), Immigrants from Morocco (3.21, a difference of 0.070%), and Immigrants from India (3.21, a difference of 0.070%).
| Demographics | Rating | Rank | Average Family Size |
| Immigrants | Azores | 21.7 /100 | #198 | Fair 3.21 |
| Hmong | 20.7 /100 | #199 | Fair 3.21 |
| Immigrants | Kenya | 19.2 /100 | #200 | Poor 3.21 |
| Immigrants | Morocco | 18.5 /100 | #201 | Poor 3.21 |
| Immigrants | India | 18.5 /100 | #202 | Poor 3.21 |
| Immigrants | Nepal | 18.1 /100 | #203 | Poor 3.21 |
| Immigrants | Poland | 16.6 /100 | #204 | Poor 3.20 |
| Paraguayans | 16.3 /100 | #205 | Poor 3.20 |
| Immigrants | Cabo Verde | 16.0 /100 | #206 | Poor 3.20 |
| Filipinos | 13.6 /100 | #207 | Poor 3.20 |
| Chippewa | 13.3 /100 | #208 | Poor 3.20 |
| Sudanese | 13.3 /100 | #209 | Poor 3.20 |
| Zimbabweans | 12.6 /100 | #210 | Poor 3.20 |
| Immigrants | Iran | 12.1 /100 | #211 | Poor 3.20 |
| Creek | 12.1 /100 | #212 | Poor 3.20 |