Australian vs West Indian Single Father Households
COMPARE
Australian
West Indian
Single Father Households
Single Father Households Comparison
Australians
West Indians
2.2%
SINGLE FATHER HOUSEHOLDS
97.7/ 100
METRIC RATING
120th/ 347
METRIC RANK
2.2%
SINGLE FATHER HOUSEHOLDS
94.1/ 100
METRIC RATING
138th/ 347
METRIC RANK
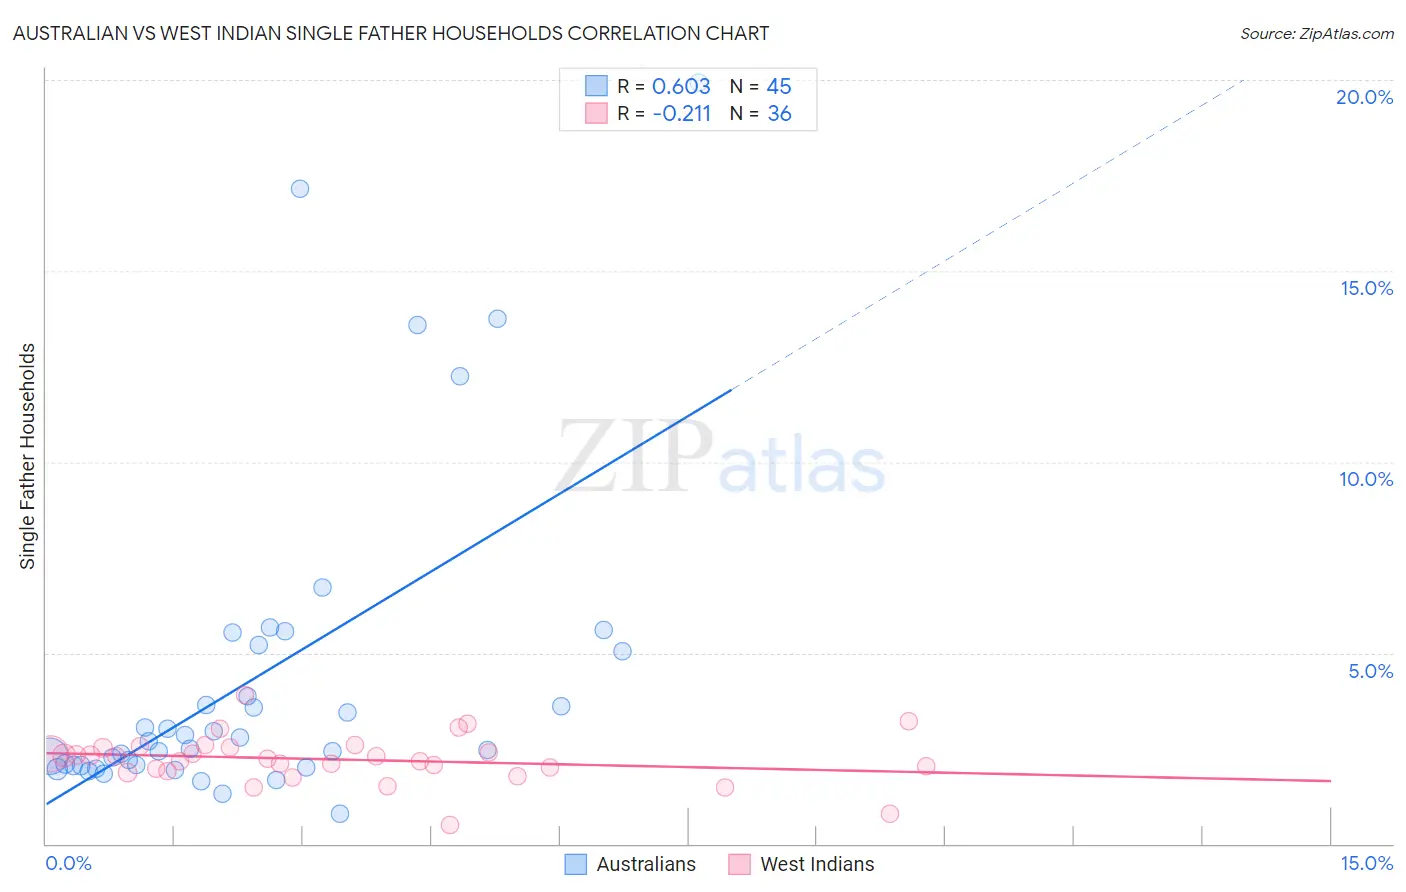
Australian vs West Indian Single Father Households Correlation Chart
The statistical analysis conducted on geographies consisting of 222,691,289 people shows a significant positive correlation between the proportion of Australians and percentage of single father households in the United States with a correlation coefficient (R) of 0.603 and weighted average of 2.2%. Similarly, the statistical analysis conducted on geographies consisting of 252,761,215 people shows a weak negative correlation between the proportion of West Indians and percentage of single father households in the United States with a correlation coefficient (R) of -0.211 and weighted average of 2.2%, a difference of 2.0%.
Single Father Households Correlation Summary
| Measurement | Australian | West Indian |
| Minimum | 0.78% | 0.49% |
| Maximum | 19.9% | 3.9% |
| Range | 19.2% | 3.4% |
| Mean | 4.3% | 2.2% |
| Median | 2.7% | 2.3% |
| Interquartile 25% (IQ1) | 2.0% | 1.9% |
| Interquartile 75% (IQ3) | 5.1% | 2.5% |
| Interquartile Range (IQR) | 3.1% | 0.60% |
| Standard Deviation (Sample) | 4.3% | 0.64% |
| Standard Deviation (Population) | 4.2% | 0.63% |
Demographics Similar to Australians and West Indians by Single Father Households
In terms of single father households, the demographic groups most similar to Australians are Immigrants from Brazil (2.2%, a difference of 0.0%), Trinidadian and Tobagonian (2.2%, a difference of 0.030%), Immigrants from Iraq (2.2%, a difference of 0.10%), Immigrants from Yemen (2.2%, a difference of 0.25%), and British West Indian (2.2%, a difference of 0.27%). Similarly, the demographic groups most similar to West Indians are Austrian (2.2%, a difference of 0.030%), Chilean (2.2%, a difference of 0.14%), Syrian (2.2%, a difference of 0.26%), Zimbabwean (2.2%, a difference of 0.37%), and Brazilian (2.2%, a difference of 0.42%).
| Demographics | Rating | Rank | Single Father Households |
| Trinidadians and Tobagonians | 97.8 /100 | #119 | Exceptional 2.2% |
| Australians | 97.7 /100 | #120 | Exceptional 2.2% |
| Immigrants | Brazil | 97.7 /100 | #121 | Exceptional 2.2% |
| Immigrants | Iraq | 97.6 /100 | #122 | Exceptional 2.2% |
| Immigrants | Yemen | 97.5 /100 | #123 | Exceptional 2.2% |
| British West Indians | 97.4 /100 | #124 | Exceptional 2.2% |
| Immigrants | Indonesia | 97.4 /100 | #125 | Exceptional 2.2% |
| Moroccans | 96.9 /100 | #126 | Exceptional 2.2% |
| Jordanians | 96.9 /100 | #127 | Exceptional 2.2% |
| Immigrants | England | 96.8 /100 | #128 | Exceptional 2.2% |
| Serbians | 96.8 /100 | #129 | Exceptional 2.2% |
| Immigrants | Chile | 96.7 /100 | #130 | Exceptional 2.2% |
| Immigrants | Jordan | 96.6 /100 | #131 | Exceptional 2.2% |
| Poles | 96.5 /100 | #132 | Exceptional 2.2% |
| Taiwanese | 96.3 /100 | #133 | Exceptional 2.2% |
| Zimbabweans | 95.1 /100 | #134 | Exceptional 2.2% |
| Syrians | 94.8 /100 | #135 | Exceptional 2.2% |
| Chileans | 94.5 /100 | #136 | Exceptional 2.2% |
| Austrians | 94.2 /100 | #137 | Exceptional 2.2% |
| West Indians | 94.1 /100 | #138 | Exceptional 2.2% |
| Brazilians | 92.8 /100 | #139 | Exceptional 2.2% |