Ute vs West Indian Single Father Households
COMPARE
Ute
West Indian
Single Father Households
Single Father Households Comparison
Ute
West Indians
3.0%
SINGLE FATHER HOUSEHOLDS
0.0/ 100
METRIC RATING
319th/ 347
METRIC RANK
2.2%
SINGLE FATHER HOUSEHOLDS
94.1/ 100
METRIC RATING
138th/ 347
METRIC RANK
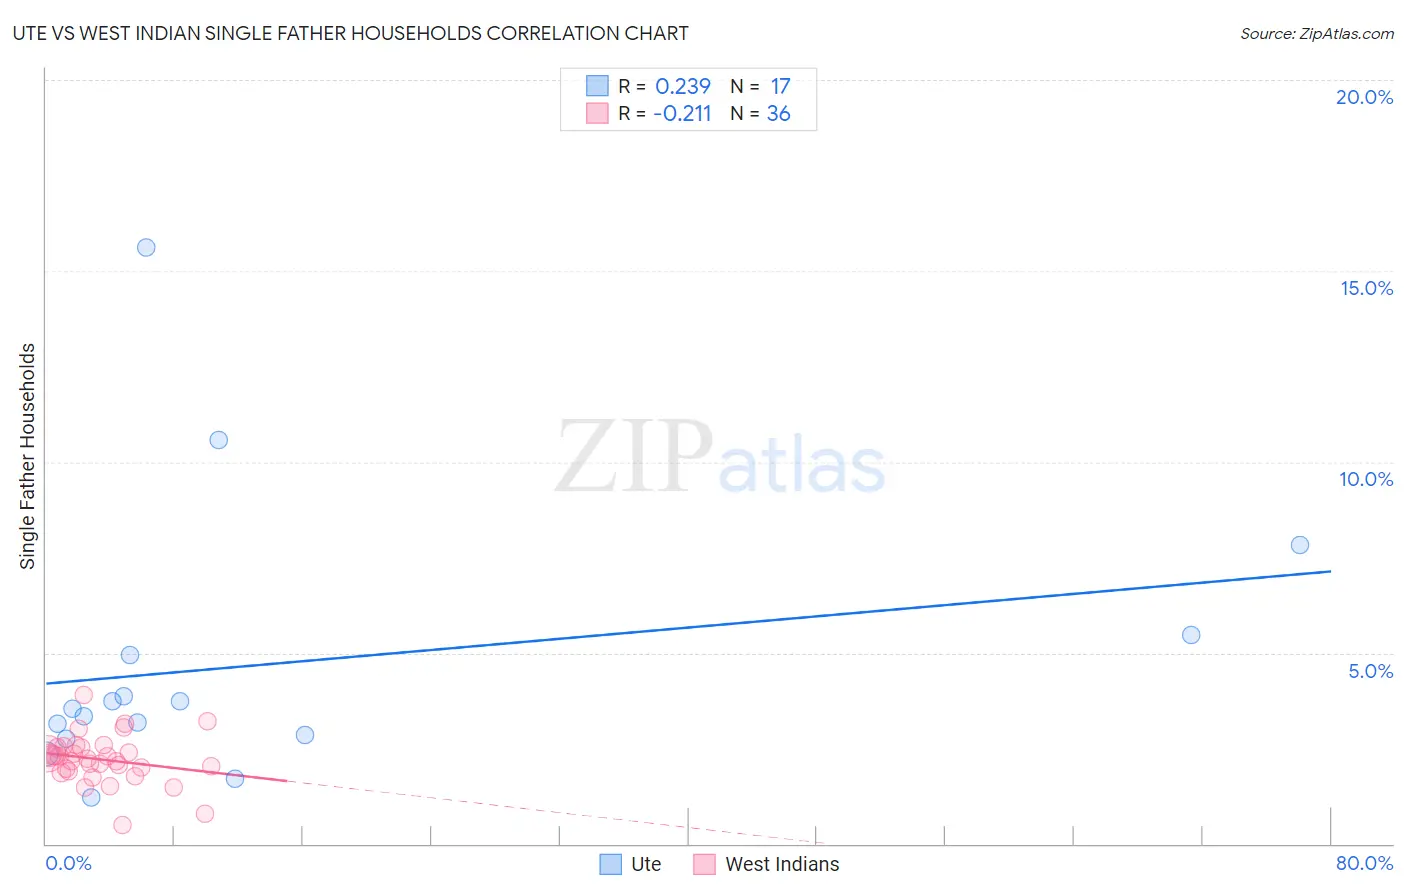
Ute vs West Indian Single Father Households Correlation Chart
The statistical analysis conducted on geographies consisting of 55,604,261 people shows a weak positive correlation between the proportion of Ute and percentage of single father households in the United States with a correlation coefficient (R) of 0.239 and weighted average of 3.0%. Similarly, the statistical analysis conducted on geographies consisting of 252,761,215 people shows a weak negative correlation between the proportion of West Indians and percentage of single father households in the United States with a correlation coefficient (R) of -0.211 and weighted average of 2.2%, a difference of 33.5%.
Single Father Households Correlation Summary
| Measurement | Ute | West Indian |
| Minimum | 1.2% | 0.49% |
| Maximum | 15.6% | 3.9% |
| Range | 14.4% | 3.4% |
| Mean | 4.7% | 2.2% |
| Median | 3.5% | 2.3% |
| Interquartile 25% (IQ1) | 2.8% | 1.9% |
| Interquartile 75% (IQ3) | 5.2% | 2.5% |
| Interquartile Range (IQR) | 2.4% | 0.60% |
| Standard Deviation (Sample) | 3.6% | 0.64% |
| Standard Deviation (Population) | 3.5% | 0.63% |
Similar Demographics by Single Father Households
Demographics Similar to Ute by Single Father Households
In terms of single father households, the demographic groups most similar to Ute are Guatemalan (3.0%, a difference of 0.080%), Mexican (3.0%, a difference of 0.47%), Cape Verdean (2.9%, a difference of 0.53%), Immigrants from El Salvador (2.9%, a difference of 0.54%), and Immigrants from Guatemala (3.0%, a difference of 1.0%).
| Demographics | Rating | Rank | Single Father Households |
| Tsimshian | 0.0 /100 | #312 | Tragic 2.9% |
| Arapaho | 0.0 /100 | #313 | Tragic 2.9% |
| Salvadorans | 0.0 /100 | #314 | Tragic 2.9% |
| Cheyenne | 0.0 /100 | #315 | Tragic 2.9% |
| Houma | 0.0 /100 | #316 | Tragic 2.9% |
| Immigrants | El Salvador | 0.0 /100 | #317 | Tragic 2.9% |
| Cape Verdeans | 0.0 /100 | #318 | Tragic 2.9% |
| Ute | 0.0 /100 | #319 | Tragic 3.0% |
| Guatemalans | 0.0 /100 | #320 | Tragic 3.0% |
| Mexicans | 0.0 /100 | #321 | Tragic 3.0% |
| Immigrants | Guatemala | 0.0 /100 | #322 | Tragic 3.0% |
| Immigrants | Central America | 0.0 /100 | #323 | Tragic 3.0% |
| Fijians | 0.0 /100 | #324 | Tragic 3.0% |
| Immigrants | Mexico | 0.0 /100 | #325 | Tragic 3.0% |
| Aleuts | 0.0 /100 | #326 | Tragic 3.0% |
Demographics Similar to West Indians by Single Father Households
In terms of single father households, the demographic groups most similar to West Indians are Austrian (2.2%, a difference of 0.030%), Chilean (2.2%, a difference of 0.14%), Syrian (2.2%, a difference of 0.26%), Zimbabwean (2.2%, a difference of 0.37%), and Brazilian (2.2%, a difference of 0.42%).
| Demographics | Rating | Rank | Single Father Households |
| Immigrants | Jordan | 96.6 /100 | #131 | Exceptional 2.2% |
| Poles | 96.5 /100 | #132 | Exceptional 2.2% |
| Taiwanese | 96.3 /100 | #133 | Exceptional 2.2% |
| Zimbabweans | 95.1 /100 | #134 | Exceptional 2.2% |
| Syrians | 94.8 /100 | #135 | Exceptional 2.2% |
| Chileans | 94.5 /100 | #136 | Exceptional 2.2% |
| Austrians | 94.2 /100 | #137 | Exceptional 2.2% |
| West Indians | 94.1 /100 | #138 | Exceptional 2.2% |
| Brazilians | 92.8 /100 | #139 | Exceptional 2.2% |
| British | 92.8 /100 | #140 | Exceptional 2.2% |
| Laotians | 92.5 /100 | #141 | Exceptional 2.2% |
| Luxembourgers | 92.3 /100 | #142 | Exceptional 2.2% |
| Immigrants | Nepal | 92.1 /100 | #143 | Exceptional 2.2% |
| Slovaks | 90.7 /100 | #144 | Exceptional 2.2% |
| Immigrants | Zimbabwe | 90.2 /100 | #145 | Exceptional 2.2% |