White/Caucasian vs Shoshone Single Father Households
COMPARE
White/Caucasian
Shoshone
Single Father Households
Single Father Households Comparison
Whites/Caucasians
Shoshone
2.4%
SINGLE FATHER HOUSEHOLDS
22.6/ 100
METRIC RATING
207th/ 347
METRIC RANK
2.6%
SINGLE FATHER HOUSEHOLDS
0.1/ 100
METRIC RATING
277th/ 347
METRIC RANK
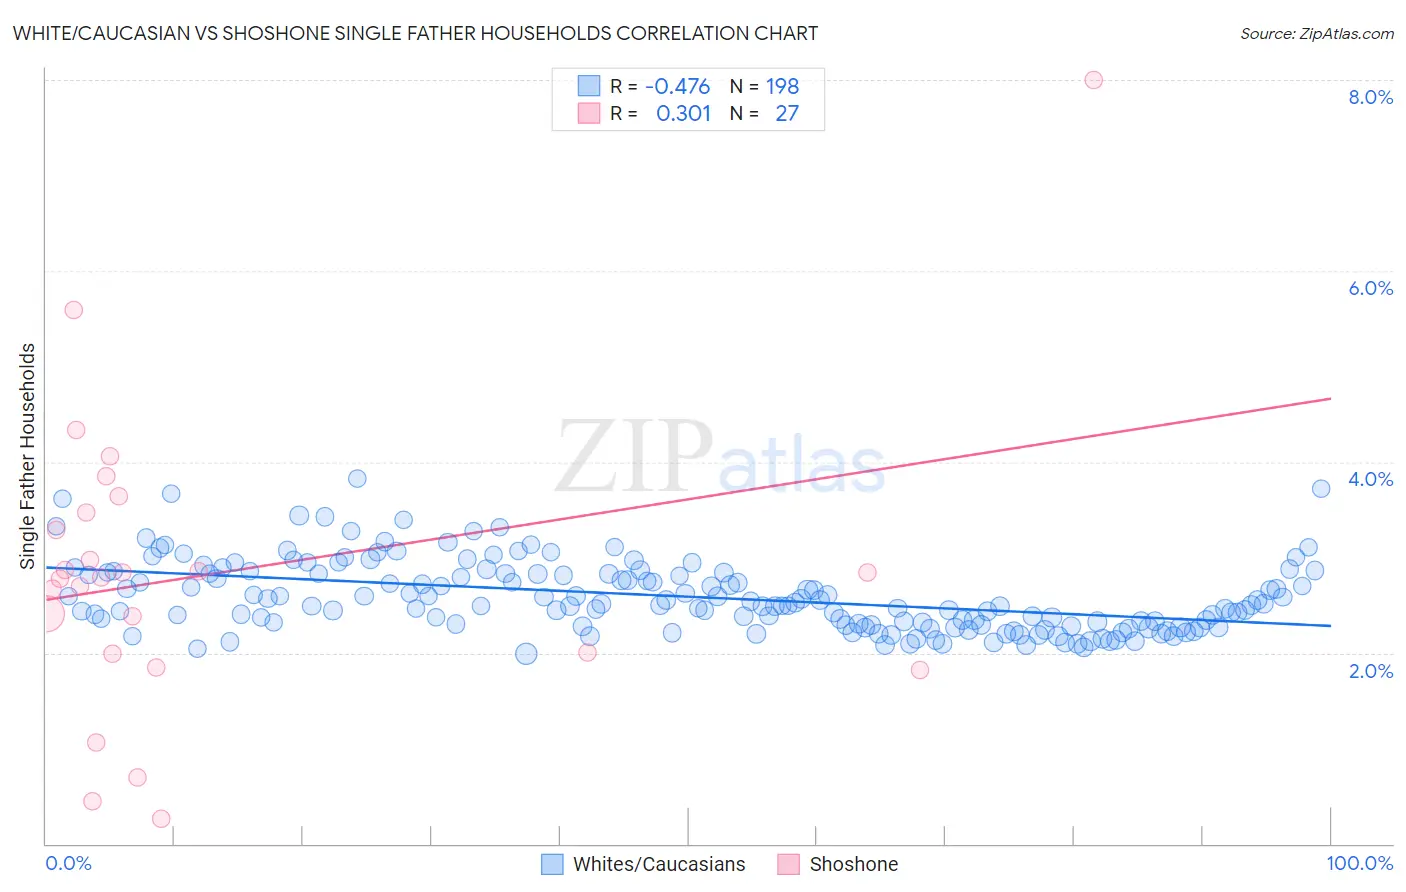
White/Caucasian vs Shoshone Single Father Households Correlation Chart
The statistical analysis conducted on geographies consisting of 565,193,918 people shows a moderate negative correlation between the proportion of Whites/Caucasians and percentage of single father households in the United States with a correlation coefficient (R) of -0.476 and weighted average of 2.4%. Similarly, the statistical analysis conducted on geographies consisting of 66,467,409 people shows a mild positive correlation between the proportion of Shoshone and percentage of single father households in the United States with a correlation coefficient (R) of 0.301 and weighted average of 2.6%, a difference of 9.7%.
Single Father Households Correlation Summary
| Measurement | White/Caucasian | Shoshone |
| Minimum | 2.0% | 0.27% |
| Maximum | 3.8% | 8.0% |
| Range | 1.8% | 7.7% |
| Mean | 2.6% | 2.8% |
| Median | 2.5% | 2.8% |
| Interquartile 25% (IQ1) | 2.3% | 2.0% |
| Interquartile 75% (IQ3) | 2.8% | 3.5% |
| Interquartile Range (IQR) | 0.54% | 1.5% |
| Standard Deviation (Sample) | 0.37% | 1.6% |
| Standard Deviation (Population) | 0.37% | 1.5% |
Similar Demographics by Single Father Households
Demographics Similar to Whites/Caucasians by Single Father Households
In terms of single father households, the demographic groups most similar to Whites/Caucasians are Korean (2.4%, a difference of 0.15%), Immigrants from Afghanistan (2.4%, a difference of 0.16%), Ecuadorian (2.4%, a difference of 0.18%), French Canadian (2.4%, a difference of 0.21%), and Immigrants from Kenya (2.4%, a difference of 0.25%).
| Demographics | Rating | Rank | Single Father Households |
| Peruvians | 27.1 /100 | #200 | Fair 2.4% |
| Immigrants | Uganda | 26.0 /100 | #201 | Fair 2.4% |
| German Russians | 25.7 /100 | #202 | Fair 2.4% |
| French Canadians | 24.7 /100 | #203 | Fair 2.4% |
| Ecuadorians | 24.5 /100 | #204 | Fair 2.4% |
| Immigrants | Afghanistan | 24.2 /100 | #205 | Fair 2.4% |
| Koreans | 24.1 /100 | #206 | Fair 2.4% |
| Whites/Caucasians | 22.6 /100 | #207 | Fair 2.4% |
| Immigrants | Kenya | 20.3 /100 | #208 | Fair 2.4% |
| Immigrants | Peru | 19.3 /100 | #209 | Poor 2.4% |
| Immigrants | Costa Rica | 19.2 /100 | #210 | Poor 2.4% |
| Immigrants | Nigeria | 18.7 /100 | #211 | Poor 2.4% |
| Finns | 18.3 /100 | #212 | Poor 2.4% |
| Norwegians | 17.1 /100 | #213 | Poor 2.4% |
| Ethiopians | 16.6 /100 | #214 | Poor 2.4% |
Demographics Similar to Shoshone by Single Father Households
In terms of single father households, the demographic groups most similar to Shoshone are Immigrants from Haiti (2.6%, a difference of 0.030%), Cherokee (2.6%, a difference of 0.050%), Samoan (2.6%, a difference of 0.090%), Immigrants from Dominican Republic (2.6%, a difference of 0.24%), and Immigrants from Portugal (2.6%, a difference of 0.64%).
| Demographics | Rating | Rank | Single Father Households |
| Seminole | 0.3 /100 | #270 | Tragic 2.6% |
| Creek | 0.2 /100 | #271 | Tragic 2.6% |
| Belizeans | 0.2 /100 | #272 | Tragic 2.6% |
| Iroquois | 0.2 /100 | #273 | Tragic 2.6% |
| Puerto Ricans | 0.2 /100 | #274 | Tragic 2.6% |
| Immigrants | Dominican Republic | 0.2 /100 | #275 | Tragic 2.6% |
| Immigrants | Haiti | 0.1 /100 | #276 | Tragic 2.6% |
| Shoshone | 0.1 /100 | #277 | Tragic 2.6% |
| Cherokee | 0.1 /100 | #278 | Tragic 2.6% |
| Samoans | 0.1 /100 | #279 | Tragic 2.6% |
| Immigrants | Portugal | 0.1 /100 | #280 | Tragic 2.6% |
| Nicaraguans | 0.1 /100 | #281 | Tragic 2.6% |
| Dutch West Indians | 0.1 /100 | #282 | Tragic 2.6% |
| Immigrants | Nicaragua | 0.1 /100 | #283 | Tragic 2.7% |
| Hawaiians | 0.1 /100 | #284 | Tragic 2.7% |