White/Caucasian vs Basque Single Father Households
COMPARE
White/Caucasian
Basque
Single Father Households
Single Father Households Comparison
Whites/Caucasians
Basques
2.4%
SINGLE FATHER HOUSEHOLDS
22.6/ 100
METRIC RATING
207th/ 347
METRIC RANK
2.5%
SINGLE FATHER HOUSEHOLDS
2.5/ 100
METRIC RATING
245th/ 347
METRIC RANK
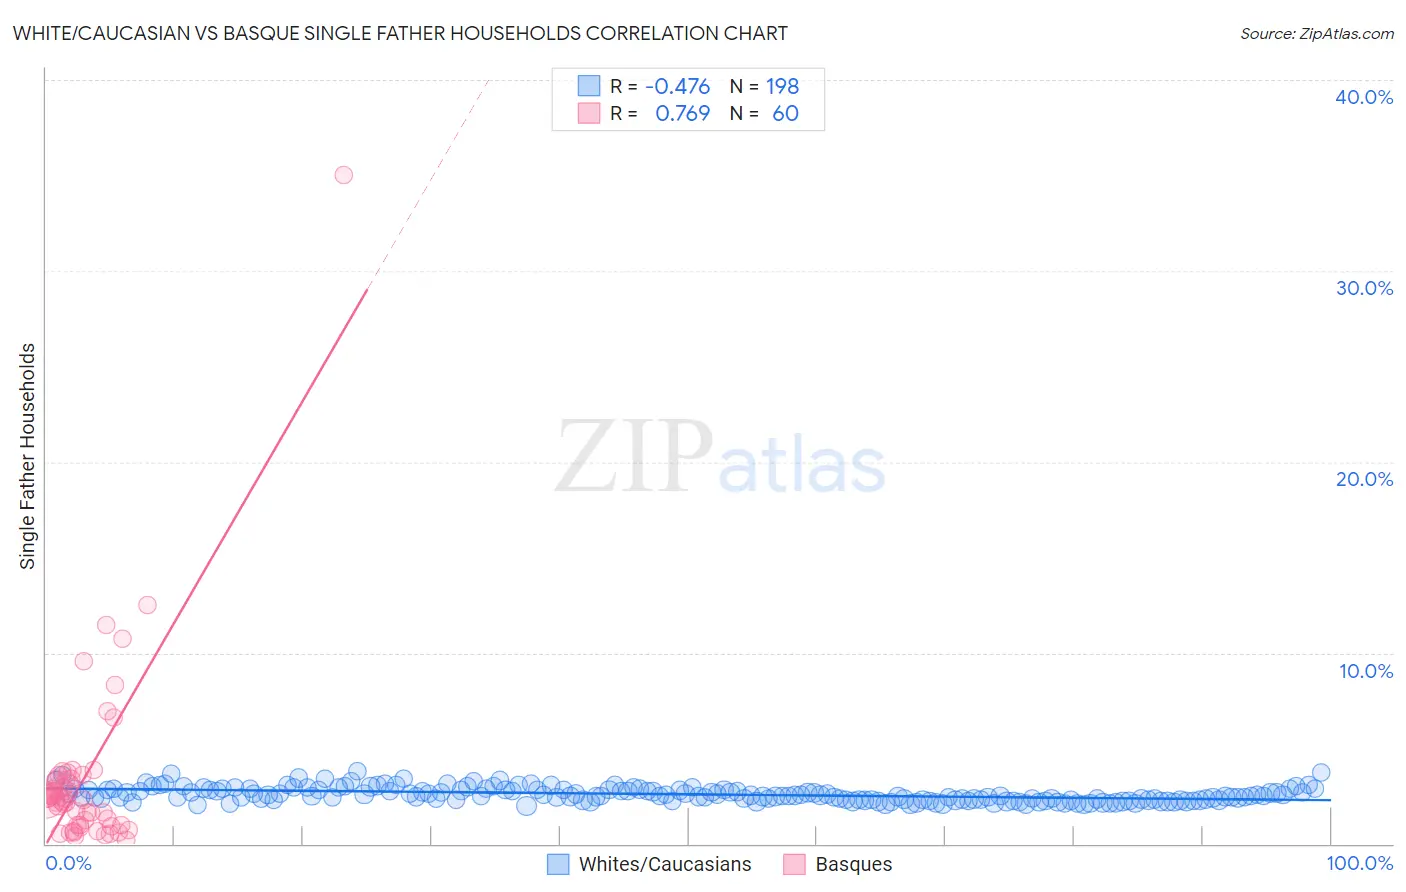
White/Caucasian vs Basque Single Father Households Correlation Chart
The statistical analysis conducted on geographies consisting of 565,193,918 people shows a moderate negative correlation between the proportion of Whites/Caucasians and percentage of single father households in the United States with a correlation coefficient (R) of -0.476 and weighted average of 2.4%. Similarly, the statistical analysis conducted on geographies consisting of 165,235,183 people shows a strong positive correlation between the proportion of Basques and percentage of single father households in the United States with a correlation coefficient (R) of 0.769 and weighted average of 2.5%, a difference of 4.4%.
Single Father Households Correlation Summary
| Measurement | White/Caucasian | Basque |
| Minimum | 2.0% | 0.20% |
| Maximum | 3.8% | 35.0% |
| Range | 1.8% | 34.8% |
| Mean | 2.6% | 3.4% |
| Median | 2.5% | 2.4% |
| Interquartile 25% (IQ1) | 2.3% | 0.99% |
| Interquartile 75% (IQ3) | 2.8% | 3.4% |
| Interquartile Range (IQR) | 0.54% | 2.4% |
| Standard Deviation (Sample) | 0.37% | 5.0% |
| Standard Deviation (Population) | 0.37% | 4.9% |
Similar Demographics by Single Father Households
Demographics Similar to Whites/Caucasians by Single Father Households
In terms of single father households, the demographic groups most similar to Whites/Caucasians are Korean (2.4%, a difference of 0.15%), Immigrants from Afghanistan (2.4%, a difference of 0.16%), Ecuadorian (2.4%, a difference of 0.18%), French Canadian (2.4%, a difference of 0.21%), and Immigrants from Kenya (2.4%, a difference of 0.25%).
| Demographics | Rating | Rank | Single Father Households |
| Peruvians | 27.1 /100 | #200 | Fair 2.4% |
| Immigrants | Uganda | 26.0 /100 | #201 | Fair 2.4% |
| German Russians | 25.7 /100 | #202 | Fair 2.4% |
| French Canadians | 24.7 /100 | #203 | Fair 2.4% |
| Ecuadorians | 24.5 /100 | #204 | Fair 2.4% |
| Immigrants | Afghanistan | 24.2 /100 | #205 | Fair 2.4% |
| Koreans | 24.1 /100 | #206 | Fair 2.4% |
| Whites/Caucasians | 22.6 /100 | #207 | Fair 2.4% |
| Immigrants | Kenya | 20.3 /100 | #208 | Fair 2.4% |
| Immigrants | Peru | 19.3 /100 | #209 | Poor 2.4% |
| Immigrants | Costa Rica | 19.2 /100 | #210 | Poor 2.4% |
| Immigrants | Nigeria | 18.7 /100 | #211 | Poor 2.4% |
| Finns | 18.3 /100 | #212 | Poor 2.4% |
| Norwegians | 17.1 /100 | #213 | Poor 2.4% |
| Ethiopians | 16.6 /100 | #214 | Poor 2.4% |
Demographics Similar to Basques by Single Father Households
In terms of single father households, the demographic groups most similar to Basques are Native Hawaiian (2.5%, a difference of 0.020%), Delaware (2.5%, a difference of 0.030%), Bahamian (2.5%, a difference of 0.080%), Immigrants from Cameroon (2.5%, a difference of 0.16%), and Immigrants from Middle Africa (2.5%, a difference of 0.21%).
| Demographics | Rating | Rank | Single Father Households |
| Immigrants | Sierra Leone | 5.8 /100 | #238 | Tragic 2.5% |
| Immigrants | Oceania | 5.8 /100 | #239 | Tragic 2.5% |
| Immigrants | Dominica | 4.8 /100 | #240 | Tragic 2.5% |
| Portuguese | 4.1 /100 | #241 | Tragic 2.5% |
| Osage | 4.1 /100 | #242 | Tragic 2.5% |
| Spaniards | 3.1 /100 | #243 | Tragic 2.5% |
| Immigrants | Middle Africa | 2.8 /100 | #244 | Tragic 2.5% |
| Basques | 2.5 /100 | #245 | Tragic 2.5% |
| Native Hawaiians | 2.5 /100 | #246 | Tragic 2.5% |
| Delaware | 2.5 /100 | #247 | Tragic 2.5% |
| Bahamians | 2.4 /100 | #248 | Tragic 2.5% |
| Immigrants | Cameroon | 2.3 /100 | #249 | Tragic 2.5% |
| Somalis | 2.1 /100 | #250 | Tragic 2.5% |
| Liberians | 2.0 /100 | #251 | Tragic 2.5% |
| Immigrants | Eritrea | 2.0 /100 | #252 | Tragic 2.5% |