White/Caucasian vs Puget Sound Salish Single Father Households
COMPARE
White/Caucasian
Puget Sound Salish
Single Father Households
Single Father Households Comparison
Whites/Caucasians
Puget Sound Salish
2.4%
SINGLE FATHER HOUSEHOLDS
22.6/ 100
METRIC RATING
207th/ 347
METRIC RANK
2.7%
SINGLE FATHER HOUSEHOLDS
0.0/ 100
METRIC RATING
290th/ 347
METRIC RANK
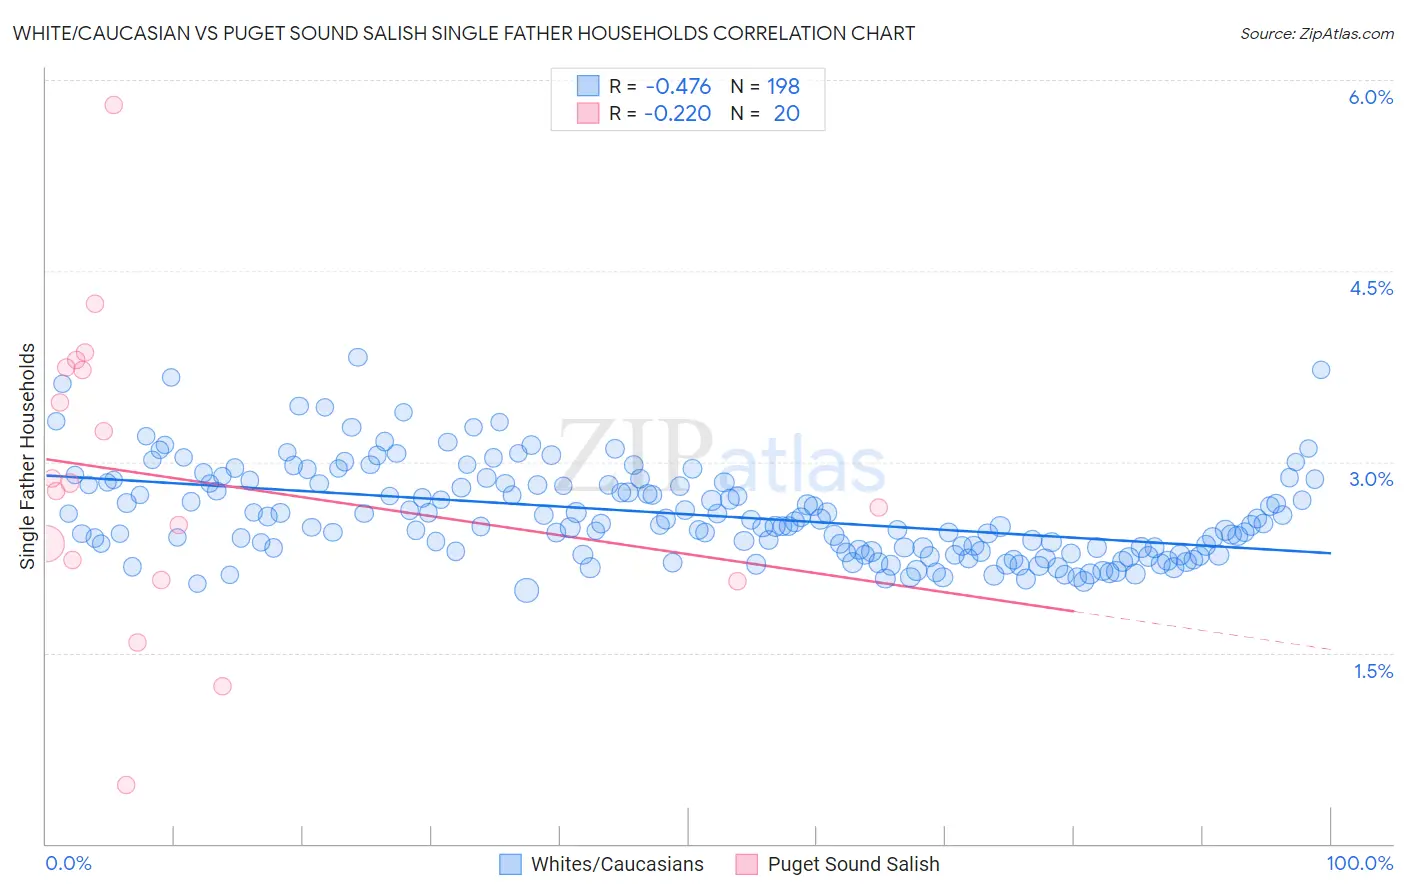
White/Caucasian vs Puget Sound Salish Single Father Households Correlation Chart
The statistical analysis conducted on geographies consisting of 565,193,918 people shows a moderate negative correlation between the proportion of Whites/Caucasians and percentage of single father households in the United States with a correlation coefficient (R) of -0.476 and weighted average of 2.4%. Similarly, the statistical analysis conducted on geographies consisting of 46,042,522 people shows a weak negative correlation between the proportion of Puget Sound Salish and percentage of single father households in the United States with a correlation coefficient (R) of -0.220 and weighted average of 2.7%, a difference of 12.4%.
Single Father Households Correlation Summary
| Measurement | White/Caucasian | Puget Sound Salish |
| Minimum | 2.0% | 0.46% |
| Maximum | 3.8% | 5.8% |
| Range | 1.8% | 5.3% |
| Mean | 2.6% | 2.9% |
| Median | 2.5% | 2.8% |
| Interquartile 25% (IQ1) | 2.3% | 2.2% |
| Interquartile 75% (IQ3) | 2.8% | 3.7% |
| Interquartile Range (IQR) | 0.54% | 1.6% |
| Standard Deviation (Sample) | 0.37% | 1.2% |
| Standard Deviation (Population) | 0.37% | 1.2% |
Similar Demographics by Single Father Households
Demographics Similar to Whites/Caucasians by Single Father Households
In terms of single father households, the demographic groups most similar to Whites/Caucasians are Korean (2.4%, a difference of 0.15%), Immigrants from Afghanistan (2.4%, a difference of 0.16%), Ecuadorian (2.4%, a difference of 0.18%), French Canadian (2.4%, a difference of 0.21%), and Immigrants from Kenya (2.4%, a difference of 0.25%).
| Demographics | Rating | Rank | Single Father Households |
| Peruvians | 27.1 /100 | #200 | Fair 2.4% |
| Immigrants | Uganda | 26.0 /100 | #201 | Fair 2.4% |
| German Russians | 25.7 /100 | #202 | Fair 2.4% |
| French Canadians | 24.7 /100 | #203 | Fair 2.4% |
| Ecuadorians | 24.5 /100 | #204 | Fair 2.4% |
| Immigrants | Afghanistan | 24.2 /100 | #205 | Fair 2.4% |
| Koreans | 24.1 /100 | #206 | Fair 2.4% |
| Whites/Caucasians | 22.6 /100 | #207 | Fair 2.4% |
| Immigrants | Kenya | 20.3 /100 | #208 | Fair 2.4% |
| Immigrants | Peru | 19.3 /100 | #209 | Poor 2.4% |
| Immigrants | Costa Rica | 19.2 /100 | #210 | Poor 2.4% |
| Immigrants | Nigeria | 18.7 /100 | #211 | Poor 2.4% |
| Finns | 18.3 /100 | #212 | Poor 2.4% |
| Norwegians | 17.1 /100 | #213 | Poor 2.4% |
| Ethiopians | 16.6 /100 | #214 | Poor 2.4% |
Demographics Similar to Puget Sound Salish by Single Father Households
In terms of single father households, the demographic groups most similar to Puget Sound Salish are Tlingit-Haida (2.7%, a difference of 0.45%), Immigrants from Cambodia (2.7%, a difference of 0.52%), Blackfeet (2.7%, a difference of 0.56%), Central American Indian (2.7%, a difference of 0.77%), and Immigrants from Cuba (2.7%, a difference of 0.92%).
| Demographics | Rating | Rank | Single Father Households |
| Immigrants | Nicaragua | 0.1 /100 | #283 | Tragic 2.7% |
| Hawaiians | 0.1 /100 | #284 | Tragic 2.7% |
| Ottawa | 0.1 /100 | #285 | Tragic 2.7% |
| Immigrants | Cuba | 0.1 /100 | #286 | Tragic 2.7% |
| Central American Indians | 0.0 /100 | #287 | Tragic 2.7% |
| Immigrants | Cambodia | 0.0 /100 | #288 | Tragic 2.7% |
| Tlingit-Haida | 0.0 /100 | #289 | Tragic 2.7% |
| Puget Sound Salish | 0.0 /100 | #290 | Tragic 2.7% |
| Blackfeet | 0.0 /100 | #291 | Tragic 2.7% |
| Choctaw | 0.0 /100 | #292 | Tragic 2.7% |
| Immigrants | Fiji | 0.0 /100 | #293 | Tragic 2.7% |
| Malaysians | 0.0 /100 | #294 | Tragic 2.7% |
| Chickasaw | 0.0 /100 | #295 | Tragic 2.8% |
| Japanese | 0.0 /100 | #296 | Tragic 2.8% |
| Hondurans | 0.0 /100 | #297 | Tragic 2.8% |