Immigrants from South America vs West Indian Single Father Households
COMPARE
Immigrants from South America
West Indian
Single Father Households
Single Father Households Comparison
Immigrants from South America
West Indians
2.3%
SINGLE FATHER HOUSEHOLDS
79.9/ 100
METRIC RATING
156th/ 347
METRIC RANK
2.2%
SINGLE FATHER HOUSEHOLDS
94.1/ 100
METRIC RATING
138th/ 347
METRIC RANK
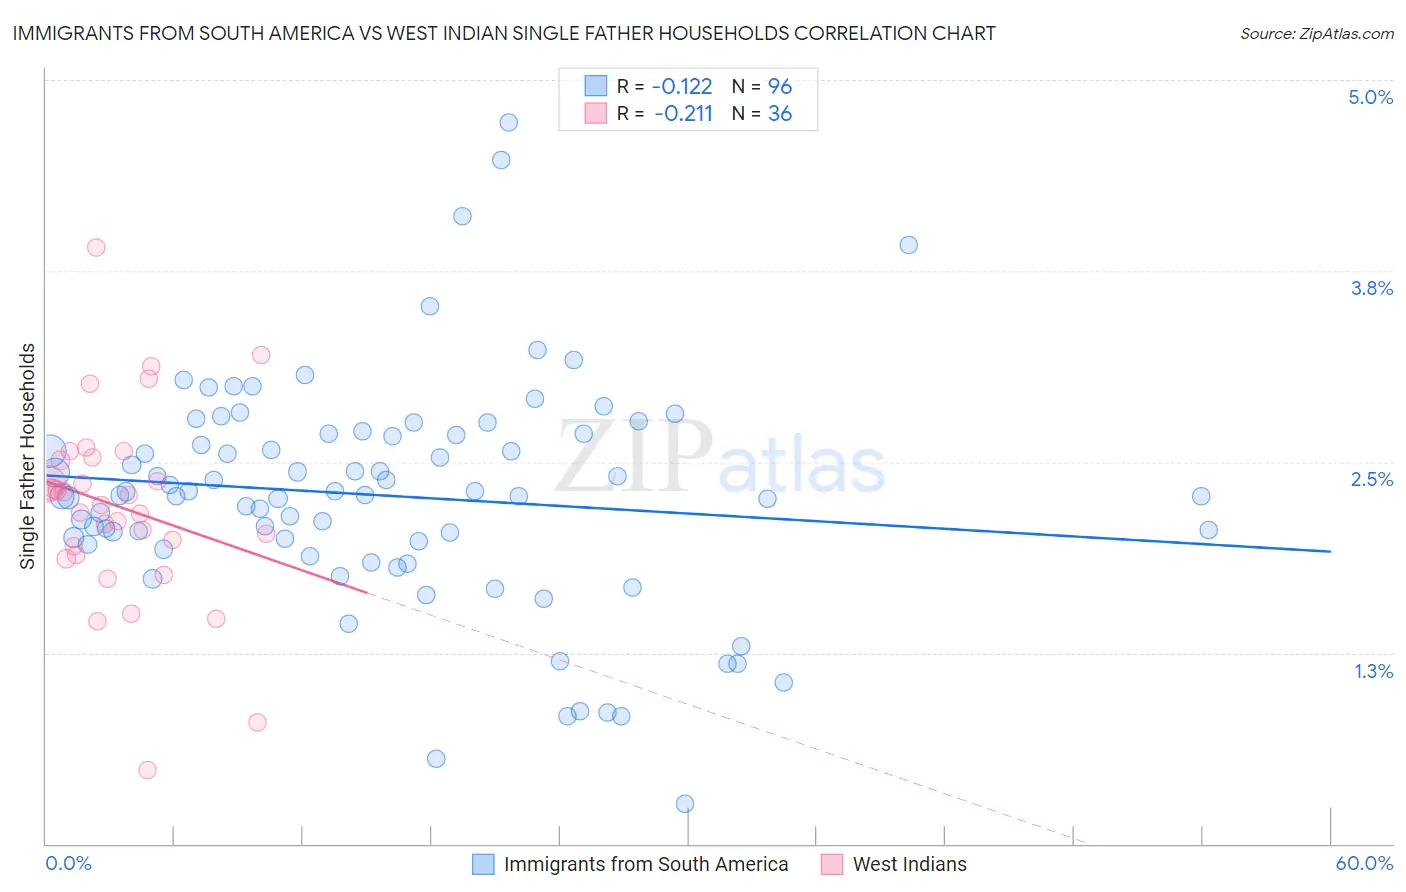
Immigrants from South America vs West Indian Single Father Households Correlation Chart
The statistical analysis conducted on geographies consisting of 479,744,076 people shows a poor negative correlation between the proportion of Immigrants from South America and percentage of single father households in the United States with a correlation coefficient (R) of -0.122 and weighted average of 2.3%. Similarly, the statistical analysis conducted on geographies consisting of 252,761,215 people shows a weak negative correlation between the proportion of West Indians and percentage of single father households in the United States with a correlation coefficient (R) of -0.211 and weighted average of 2.2%, a difference of 2.7%.
Single Father Households Correlation Summary
| Measurement | Immigrants from South America | West Indian |
| Minimum | 0.26% | 0.49% |
| Maximum | 4.7% | 3.9% |
| Range | 4.5% | 3.4% |
| Mean | 2.3% | 2.2% |
| Median | 2.3% | 2.3% |
| Interquartile 25% (IQ1) | 2.0% | 1.9% |
| Interquartile 75% (IQ3) | 2.7% | 2.5% |
| Interquartile Range (IQR) | 0.71% | 0.60% |
| Standard Deviation (Sample) | 0.75% | 0.64% |
| Standard Deviation (Population) | 0.74% | 0.63% |
Demographics Similar to Immigrants from South America and West Indians by Single Father Households
In terms of single father households, the demographic groups most similar to Immigrants from South America are Canadian (2.3%, a difference of 0.020%), European (2.3%, a difference of 0.12%), Bolivian (2.3%, a difference of 0.14%), Immigrants from Germany (2.3%, a difference of 0.36%), and Immigrants from Venezuela (2.3%, a difference of 0.41%). Similarly, the demographic groups most similar to West Indians are Austrian (2.2%, a difference of 0.030%), Brazilian (2.2%, a difference of 0.42%), British (2.2%, a difference of 0.43%), Laotian (2.2%, a difference of 0.52%), and Luxembourger (2.2%, a difference of 0.55%).
| Demographics | Rating | Rank | Single Father Households |
| Austrians | 94.2 /100 | #137 | Exceptional 2.2% |
| West Indians | 94.1 /100 | #138 | Exceptional 2.2% |
| Brazilians | 92.8 /100 | #139 | Exceptional 2.2% |
| British | 92.8 /100 | #140 | Exceptional 2.2% |
| Laotians | 92.5 /100 | #141 | Exceptional 2.2% |
| Luxembourgers | 92.3 /100 | #142 | Exceptional 2.2% |
| Immigrants | Nepal | 92.1 /100 | #143 | Exceptional 2.2% |
| Slovaks | 90.7 /100 | #144 | Exceptional 2.2% |
| Immigrants | Zimbabwe | 90.2 /100 | #145 | Exceptional 2.2% |
| Northern Europeans | 89.8 /100 | #146 | Excellent 2.2% |
| Slavs | 88.9 /100 | #147 | Excellent 2.2% |
| South American Indians | 88.5 /100 | #148 | Excellent 2.3% |
| Senegalese | 88.4 /100 | #149 | Excellent 2.3% |
| Venezuelans | 86.2 /100 | #150 | Excellent 2.3% |
| Immigrants | Syria | 84.8 /100 | #151 | Excellent 2.3% |
| Immigrants | Venezuela | 83.2 /100 | #152 | Excellent 2.3% |
| Immigrants | Germany | 82.8 /100 | #153 | Excellent 2.3% |
| Bolivians | 81.0 /100 | #154 | Excellent 2.3% |
| Europeans | 80.9 /100 | #155 | Excellent 2.3% |
| Immigrants | South America | 79.9 /100 | #156 | Good 2.3% |
| Canadians | 79.7 /100 | #157 | Good 2.3% |