White/Caucasian vs Bahamian Family Households
COMPARE
White/Caucasian
Bahamian
Family Households
Family Households Comparison
Whites/Caucasians
Bahamians
65.1%
FAMILY HOUSEHOLDS
97.3/ 100
METRIC RATING
106th/ 347
METRIC RANK
63.3%
FAMILY HOUSEHOLDS
1.1/ 100
METRIC RATING
252nd/ 347
METRIC RANK
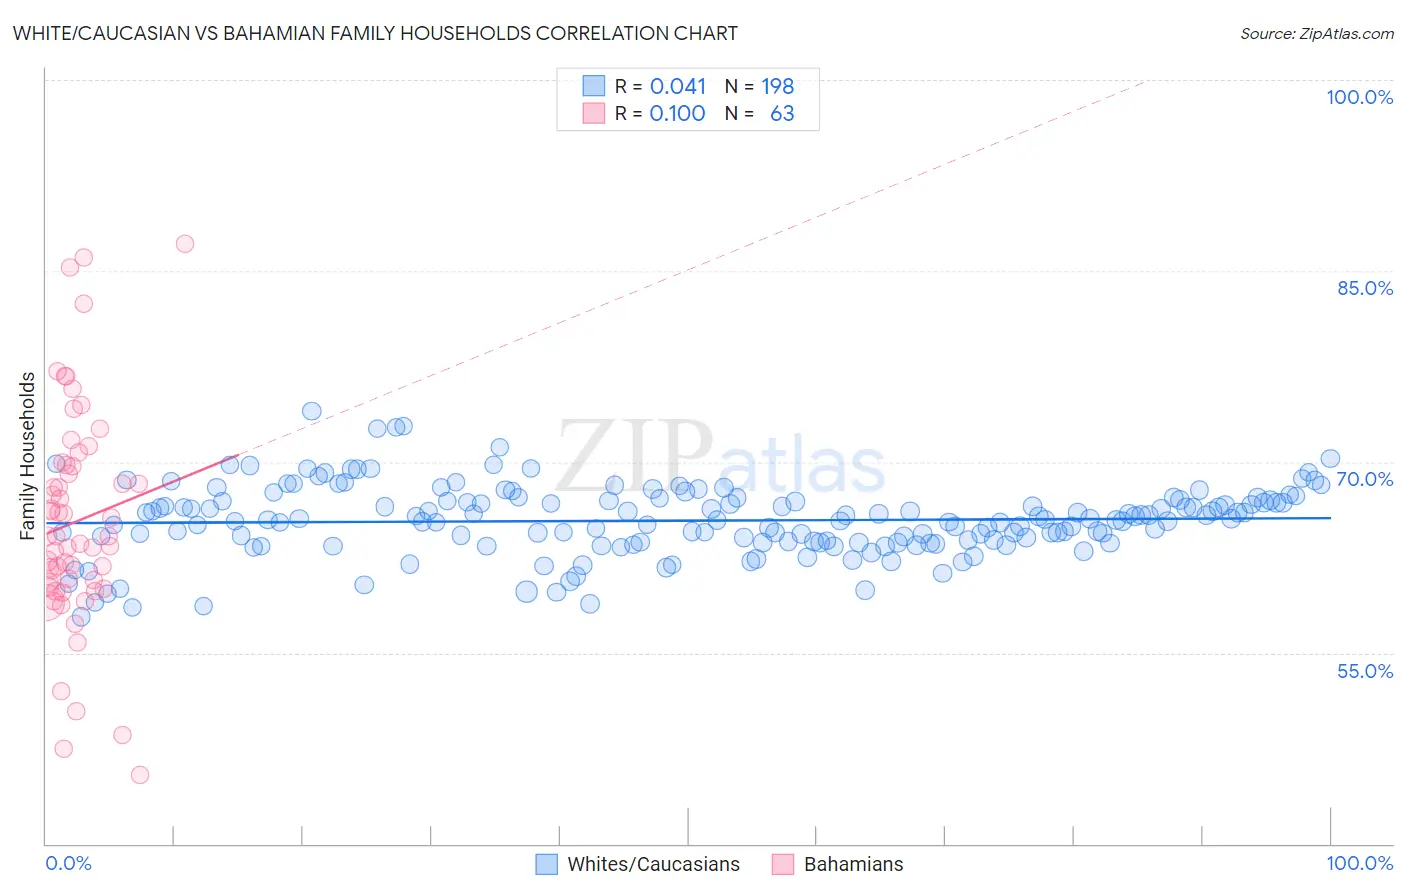
White/Caucasian vs Bahamian Family Households Correlation Chart
The statistical analysis conducted on geographies consisting of 583,404,085 people shows no correlation between the proportion of Whites/Caucasians and percentage of family households in the United States with a correlation coefficient (R) of 0.041 and weighted average of 65.1%. Similarly, the statistical analysis conducted on geographies consisting of 112,635,727 people shows a slight positive correlation between the proportion of Bahamians and percentage of family households in the United States with a correlation coefficient (R) of 0.100 and weighted average of 63.3%, a difference of 2.8%.
Family Households Correlation Summary
| Measurement | White/Caucasian | Bahamian |
| Minimum | 57.8% | 45.4% |
| Maximum | 73.9% | 87.2% |
| Range | 16.1% | 41.8% |
| Mean | 65.4% | 65.3% |
| Median | 65.4% | 64.1% |
| Interquartile 25% (IQ1) | 63.7% | 60.1% |
| Interquartile 75% (IQ3) | 66.9% | 69.7% |
| Interquartile Range (IQR) | 3.2% | 9.6% |
| Standard Deviation (Sample) | 2.8% | 8.6% |
| Standard Deviation (Population) | 2.8% | 8.5% |
Similar Demographics by Family Households
Demographics Similar to Whites/Caucasians by Family Households
In terms of family households, the demographic groups most similar to Whites/Caucasians are Alaska Native (65.1%, a difference of 0.0%), English (65.1%, a difference of 0.010%), Palestinian (65.1%, a difference of 0.010%), Immigrants from Guatemala (65.0%, a difference of 0.050%), and Scandinavian (65.0%, a difference of 0.060%).
| Demographics | Rating | Rank | Family Households |
| Central American Indians | 98.3 /100 | #99 | Exceptional 65.2% |
| Haitians | 98.1 /100 | #100 | Exceptional 65.2% |
| Chileans | 98.1 /100 | #101 | Exceptional 65.2% |
| Immigrants | Sri Lanka | 98.0 /100 | #102 | Exceptional 65.1% |
| Indians (Asian) | 97.9 /100 | #103 | Exceptional 65.1% |
| Spaniards | 97.8 /100 | #104 | Exceptional 65.1% |
| English | 97.4 /100 | #105 | Exceptional 65.1% |
| Whites/Caucasians | 97.3 /100 | #106 | Exceptional 65.1% |
| Alaska Natives | 97.3 /100 | #107 | Exceptional 65.1% |
| Palestinians | 97.2 /100 | #108 | Exceptional 65.1% |
| Immigrants | Guatemala | 96.9 /100 | #109 | Exceptional 65.0% |
| Scandinavians | 96.8 /100 | #110 | Exceptional 65.0% |
| Europeans | 96.8 /100 | #111 | Exceptional 65.0% |
| Immigrants | Jordan | 96.5 /100 | #112 | Exceptional 65.0% |
| Spanish | 96.2 /100 | #113 | Exceptional 65.0% |
Demographics Similar to Bahamians by Family Households
In terms of family households, the demographic groups most similar to Bahamians are Taiwanese (63.3%, a difference of 0.010%), Immigrants from Dominican Republic (63.3%, a difference of 0.020%), Slovak (63.3%, a difference of 0.030%), Potawatomi (63.3%, a difference of 0.050%), and Immigrants from Japan (63.4%, a difference of 0.070%).
| Demographics | Rating | Rank | Family Households |
| Immigrants | Dominica | 1.6 /100 | #245 | Tragic 63.4% |
| Immigrants | Ghana | 1.6 /100 | #246 | Tragic 63.4% |
| Immigrants | Uzbekistan | 1.5 /100 | #247 | Tragic 63.4% |
| Dominicans | 1.5 /100 | #248 | Tragic 63.4% |
| Russians | 1.4 /100 | #249 | Tragic 63.4% |
| Immigrants | Japan | 1.4 /100 | #250 | Tragic 63.4% |
| Taiwanese | 1.2 /100 | #251 | Tragic 63.3% |
| Bahamians | 1.1 /100 | #252 | Tragic 63.3% |
| Immigrants | Dominican Republic | 1.0 /100 | #253 | Tragic 63.3% |
| Slovaks | 1.0 /100 | #254 | Tragic 63.3% |
| Potawatomi | 1.0 /100 | #255 | Tragic 63.3% |
| Luxembourgers | 0.9 /100 | #256 | Tragic 63.3% |
| Icelanders | 0.8 /100 | #257 | Tragic 63.3% |
| Immigrants | Barbados | 0.7 /100 | #258 | Tragic 63.2% |
| Immigrants | Western Europe | 0.6 /100 | #259 | Tragic 63.2% |