White/Caucasian vs Central American Family Households
COMPARE
White/Caucasian
Central American
Family Households
Family Households Comparison
Whites/Caucasians
Central Americans
65.1%
FAMILY HOUSEHOLDS
97.3/ 100
METRIC RATING
106th/ 347
METRIC RANK
66.0%
FAMILY HOUSEHOLDS
100.0/ 100
METRIC RATING
62nd/ 347
METRIC RANK
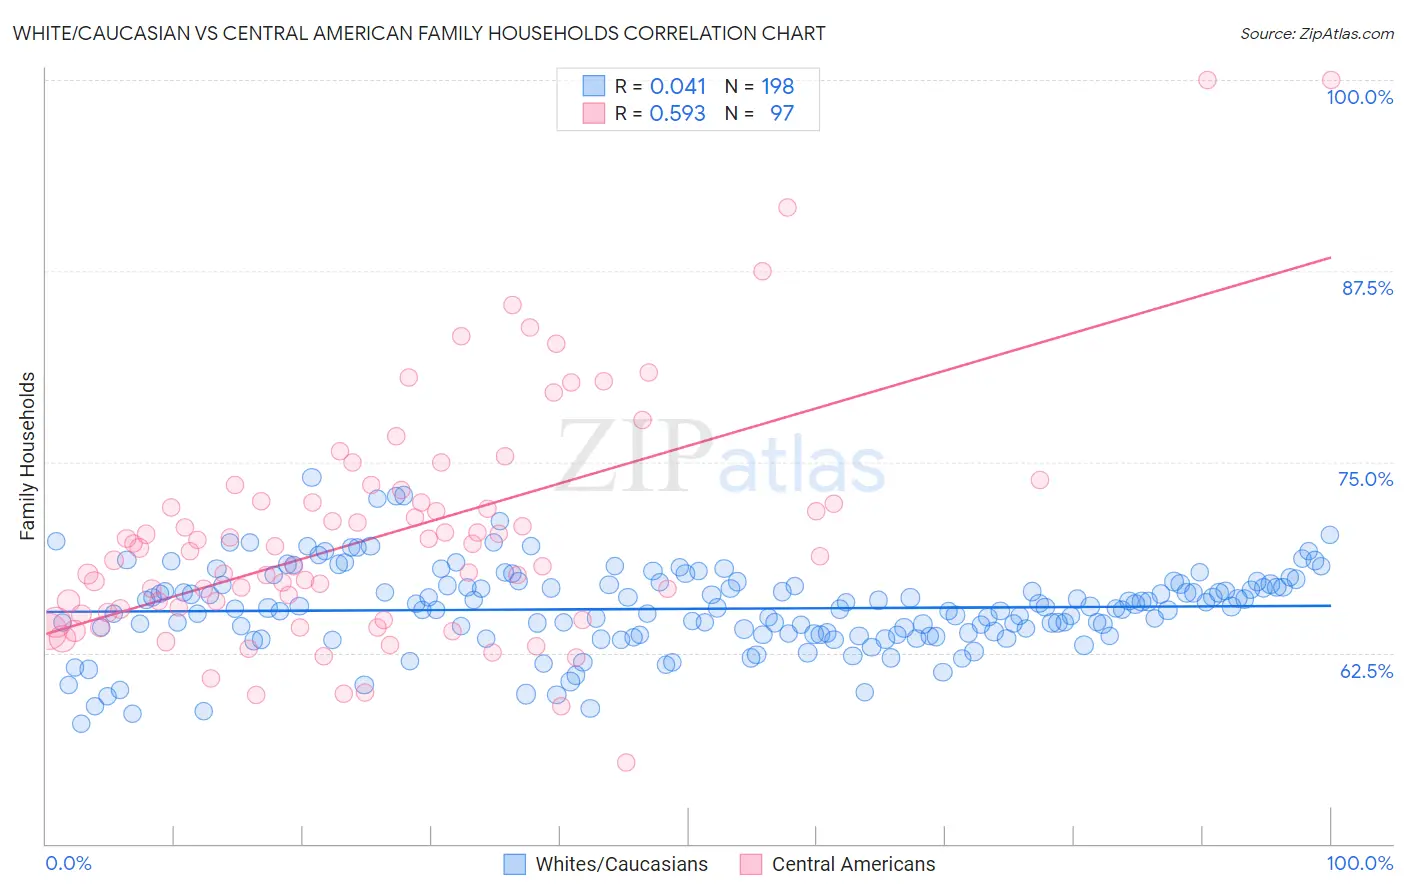
White/Caucasian vs Central American Family Households Correlation Chart
The statistical analysis conducted on geographies consisting of 583,404,085 people shows no correlation between the proportion of Whites/Caucasians and percentage of family households in the United States with a correlation coefficient (R) of 0.041 and weighted average of 65.1%. Similarly, the statistical analysis conducted on geographies consisting of 504,084,166 people shows a substantial positive correlation between the proportion of Central Americans and percentage of family households in the United States with a correlation coefficient (R) of 0.593 and weighted average of 66.0%, a difference of 1.4%.
Family Households Correlation Summary
| Measurement | White/Caucasian | Central American |
| Minimum | 57.8% | 55.3% |
| Maximum | 73.9% | 100.0% |
| Range | 16.1% | 44.7% |
| Mean | 65.4% | 70.2% |
| Median | 65.4% | 69.2% |
| Interquartile 25% (IQ1) | 63.7% | 65.1% |
| Interquartile 75% (IQ3) | 66.9% | 72.4% |
| Interquartile Range (IQR) | 3.2% | 7.3% |
| Standard Deviation (Sample) | 2.8% | 7.8% |
| Standard Deviation (Population) | 2.8% | 7.8% |
Similar Demographics by Family Households
Demographics Similar to Whites/Caucasians by Family Households
In terms of family households, the demographic groups most similar to Whites/Caucasians are Alaska Native (65.1%, a difference of 0.0%), English (65.1%, a difference of 0.010%), Palestinian (65.1%, a difference of 0.010%), Immigrants from Guatemala (65.0%, a difference of 0.050%), and Scandinavian (65.0%, a difference of 0.060%).
| Demographics | Rating | Rank | Family Households |
| Central American Indians | 98.3 /100 | #99 | Exceptional 65.2% |
| Haitians | 98.1 /100 | #100 | Exceptional 65.2% |
| Chileans | 98.1 /100 | #101 | Exceptional 65.2% |
| Immigrants | Sri Lanka | 98.0 /100 | #102 | Exceptional 65.1% |
| Indians (Asian) | 97.9 /100 | #103 | Exceptional 65.1% |
| Spaniards | 97.8 /100 | #104 | Exceptional 65.1% |
| English | 97.4 /100 | #105 | Exceptional 65.1% |
| Whites/Caucasians | 97.3 /100 | #106 | Exceptional 65.1% |
| Alaska Natives | 97.3 /100 | #107 | Exceptional 65.1% |
| Palestinians | 97.2 /100 | #108 | Exceptional 65.1% |
| Immigrants | Guatemala | 96.9 /100 | #109 | Exceptional 65.0% |
| Scandinavians | 96.8 /100 | #110 | Exceptional 65.0% |
| Europeans | 96.8 /100 | #111 | Exceptional 65.0% |
| Immigrants | Jordan | 96.5 /100 | #112 | Exceptional 65.0% |
| Spanish | 96.2 /100 | #113 | Exceptional 65.0% |
Demographics Similar to Central Americans by Family Households
In terms of family households, the demographic groups most similar to Central Americans are Danish (66.0%, a difference of 0.030%), Immigrants from Indonesia (66.0%, a difference of 0.040%), South American (66.0%, a difference of 0.050%), Immigrants from Korea (66.0%, a difference of 0.060%), and Immigrants from Asia (66.1%, a difference of 0.080%).
| Demographics | Rating | Rank | Family Households |
| Immigrants | Immigrants | 100.0 /100 | #55 | Exceptional 66.1% |
| Immigrants | Hong Kong | 100.0 /100 | #56 | Exceptional 66.1% |
| Pennsylvania Germans | 100.0 /100 | #57 | Exceptional 66.1% |
| Immigrants | Asia | 100.0 /100 | #58 | Exceptional 66.1% |
| Immigrants | Korea | 100.0 /100 | #59 | Exceptional 66.0% |
| South Americans | 100.0 /100 | #60 | Exceptional 66.0% |
| Danes | 100.0 /100 | #61 | Exceptional 66.0% |
| Central Americans | 100.0 /100 | #62 | Exceptional 66.0% |
| Immigrants | Indonesia | 100.0 /100 | #63 | Exceptional 66.0% |
| Pima | 99.9 /100 | #64 | Exceptional 65.9% |
| Costa Ricans | 99.9 /100 | #65 | Exceptional 65.9% |
| Fijians | 99.9 /100 | #66 | Exceptional 65.9% |
| Filipinos | 99.9 /100 | #67 | Exceptional 65.9% |
| Japanese | 99.9 /100 | #68 | Exceptional 65.9% |
| Malaysians | 99.9 /100 | #69 | Exceptional 65.9% |