White/Caucasian vs Ugandan Master's Degree
COMPARE
White/Caucasian
Ugandan
Master's Degree
Master's Degree Comparison
Whites/Caucasians
Ugandans
13.8%
MASTER'S DEGREE
9.1/ 100
METRIC RATING
228th/ 347
METRIC RANK
17.1%
MASTER'S DEGREE
99.0/ 100
METRIC RATING
94th/ 347
METRIC RANK
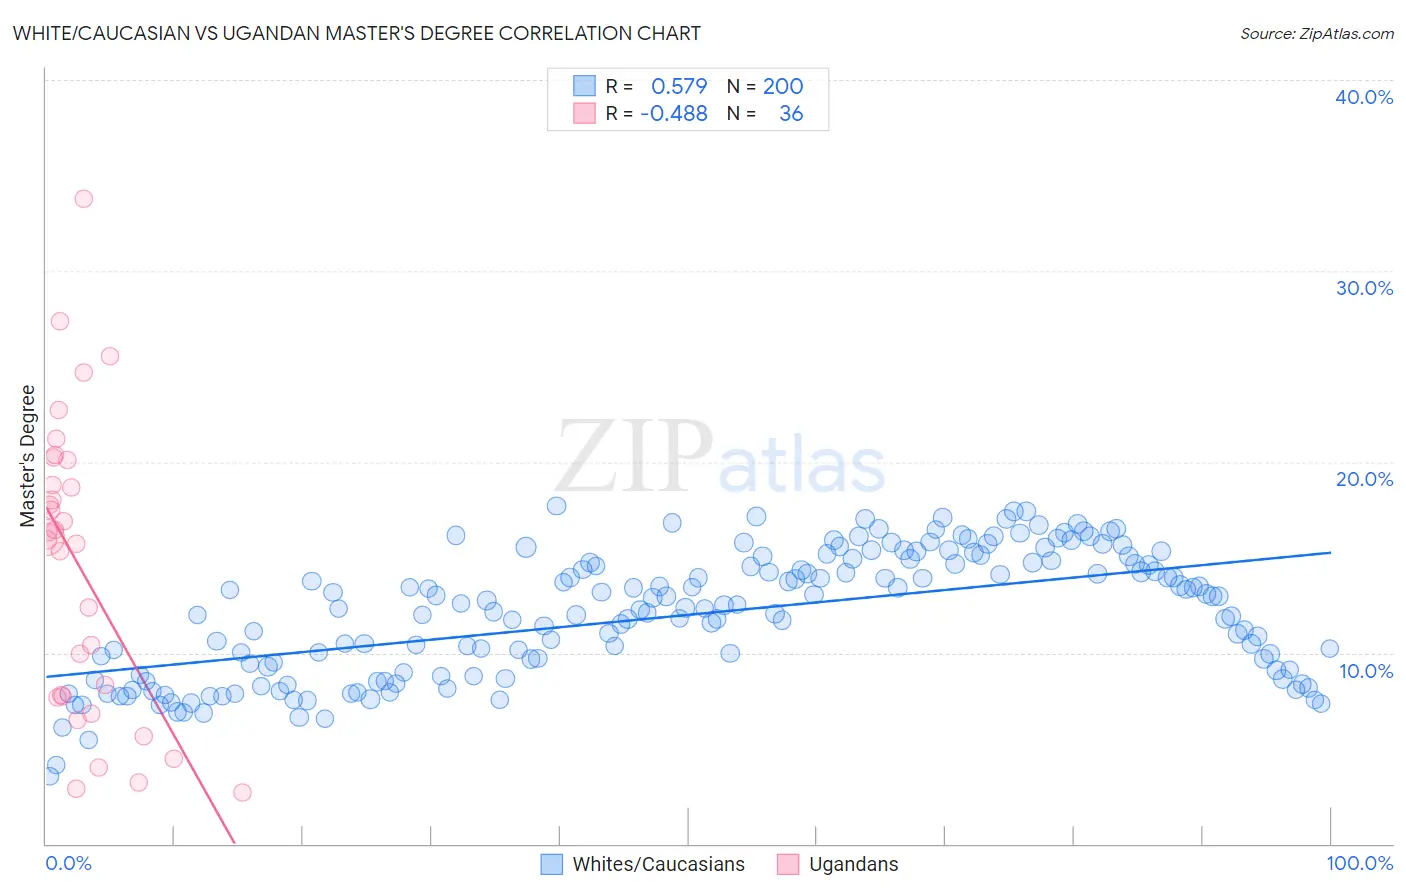
White/Caucasian vs Ugandan Master's Degree Correlation Chart
The statistical analysis conducted on geographies consisting of 583,022,214 people shows a substantial positive correlation between the proportion of Whites/Caucasians and percentage of population with at least master's degree education in the United States with a correlation coefficient (R) of 0.579 and weighted average of 13.8%. Similarly, the statistical analysis conducted on geographies consisting of 93,998,017 people shows a moderate negative correlation between the proportion of Ugandans and percentage of population with at least master's degree education in the United States with a correlation coefficient (R) of -0.488 and weighted average of 17.1%, a difference of 24.0%.
Master's Degree Correlation Summary
| Measurement | White/Caucasian | Ugandan |
| Minimum | 3.5% | 2.7% |
| Maximum | 17.7% | 33.8% |
| Range | 14.2% | 31.1% |
| Mean | 12.0% | 14.4% |
| Median | 12.3% | 16.0% |
| Interquartile 25% (IQ1) | 8.9% | 7.7% |
| Interquartile 75% (IQ3) | 14.7% | 19.4% |
| Interquartile Range (IQR) | 5.8% | 11.8% |
| Standard Deviation (Sample) | 3.2% | 7.7% |
| Standard Deviation (Population) | 3.2% | 7.6% |
Similar Demographics by Master's Degree
Demographics Similar to Whites/Caucasians by Master's Degree
In terms of master's degree, the demographic groups most similar to Whites/Caucasians are British West Indian (13.8%, a difference of 0.10%), Dutch (13.8%, a difference of 0.14%), Immigrants from West Indies (13.9%, a difference of 0.31%), Guyanese (13.7%, a difference of 0.68%), and Immigrants from St. Vincent and the Grenadines (13.9%, a difference of 0.76%).
| Demographics | Rating | Rank | Master's Degree |
| Koreans | 12.7 /100 | #221 | Poor 14.0% |
| Ecuadorians | 12.6 /100 | #222 | Poor 14.0% |
| Immigrants | South Eastern Asia | 11.9 /100 | #223 | Poor 14.0% |
| Immigrants | Grenada | 11.8 /100 | #224 | Poor 14.0% |
| Portuguese | 11.2 /100 | #225 | Poor 13.9% |
| Immigrants | St. Vincent and the Grenadines | 11.0 /100 | #226 | Poor 13.9% |
| Immigrants | West Indies | 9.8 /100 | #227 | Tragic 13.9% |
| Whites/Caucasians | 9.1 /100 | #228 | Tragic 13.8% |
| British West Indians | 8.8 /100 | #229 | Tragic 13.8% |
| Dutch | 8.7 /100 | #230 | Tragic 13.8% |
| Guyanese | 7.6 /100 | #231 | Tragic 13.7% |
| Immigrants | Philippines | 6.0 /100 | #232 | Tragic 13.6% |
| Immigrants | Ecuador | 5.7 /100 | #233 | Tragic 13.6% |
| Immigrants | Burma/Myanmar | 5.0 /100 | #234 | Tragic 13.5% |
| German Russians | 4.5 /100 | #235 | Tragic 13.5% |
Demographics Similar to Ugandans by Master's Degree
In terms of master's degree, the demographic groups most similar to Ugandans are Immigrants from Italy (17.2%, a difference of 0.13%), Immigrants from North America (17.2%, a difference of 0.19%), Romanian (17.2%, a difference of 0.24%), Immigrants from Egypt (17.2%, a difference of 0.31%), and Immigrants from Morocco (17.1%, a difference of 0.32%).
| Demographics | Rating | Rank | Master's Degree |
| Maltese | 99.3 /100 | #87 | Exceptional 17.3% |
| Immigrants | Canada | 99.2 /100 | #88 | Exceptional 17.2% |
| Bhutanese | 99.1 /100 | #89 | Exceptional 17.2% |
| Immigrants | Egypt | 99.1 /100 | #90 | Exceptional 17.2% |
| Romanians | 99.1 /100 | #91 | Exceptional 17.2% |
| Immigrants | North America | 99.1 /100 | #92 | Exceptional 17.2% |
| Immigrants | Italy | 99.1 /100 | #93 | Exceptional 17.2% |
| Ugandans | 99.0 /100 | #94 | Exceptional 17.1% |
| Immigrants | Morocco | 98.9 /100 | #95 | Exceptional 17.1% |
| Immigrants | Northern Africa | 98.9 /100 | #96 | Exceptional 17.1% |
| Immigrants | England | 98.8 /100 | #97 | Exceptional 17.0% |
| Immigrants | Ukraine | 98.8 /100 | #98 | Exceptional 17.0% |
| Laotians | 98.8 /100 | #99 | Exceptional 17.0% |
| Albanians | 98.7 /100 | #100 | Exceptional 17.0% |
| Immigrants | Nepal | 98.6 /100 | #101 | Exceptional 17.0% |