Immigrants from Serbia vs Bermudan Single Mother Households
COMPARE
Immigrants from Serbia
Bermudan
Single Mother Households
Single Mother Households Comparison
Immigrants from Serbia
Bermudans
5.4%
SINGLE MOTHER HOUSEHOLDS
99.6/ 100
METRIC RATING
38th/ 347
METRIC RANK
7.3%
SINGLE MOTHER HOUSEHOLDS
0.4/ 100
METRIC RATING
249th/ 347
METRIC RANK
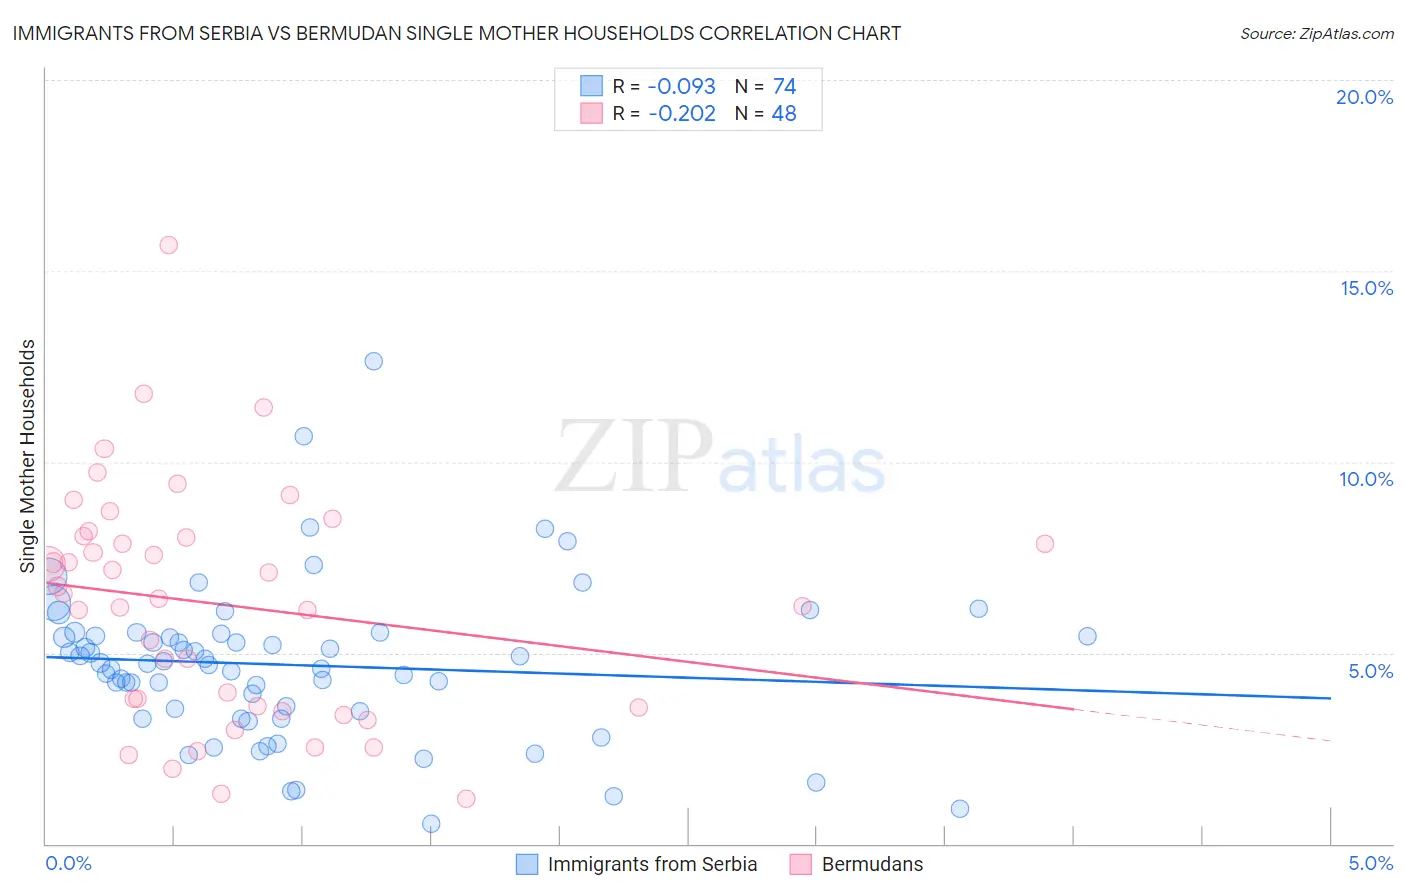
Immigrants from Serbia vs Bermudan Single Mother Households Correlation Chart
The statistical analysis conducted on geographies consisting of 131,621,048 people shows a slight negative correlation between the proportion of Immigrants from Serbia and percentage of single mother households in the United States with a correlation coefficient (R) of -0.093 and weighted average of 5.4%. Similarly, the statistical analysis conducted on geographies consisting of 55,712,440 people shows a weak negative correlation between the proportion of Bermudans and percentage of single mother households in the United States with a correlation coefficient (R) of -0.202 and weighted average of 7.3%, a difference of 36.0%.
Single Mother Households Correlation Summary
| Measurement | Immigrants from Serbia | Bermudan |
| Minimum | 0.54% | 1.2% |
| Maximum | 12.6% | 15.7% |
| Range | 12.1% | 14.5% |
| Mean | 4.7% | 6.3% |
| Median | 4.7% | 6.5% |
| Interquartile 25% (IQ1) | 3.5% | 3.6% |
| Interquartile 75% (IQ3) | 5.4% | 8.0% |
| Interquartile Range (IQR) | 2.0% | 4.5% |
| Standard Deviation (Sample) | 2.0% | 3.0% |
| Standard Deviation (Population) | 2.0% | 3.0% |
Similar Demographics by Single Mother Households
Demographics Similar to Immigrants from Serbia by Single Mother Households
In terms of single mother households, the demographic groups most similar to Immigrants from Serbia are Immigrants from Sweden (5.4%, a difference of 0.14%), Estonian (5.4%, a difference of 0.25%), Immigrants from Belgium (5.3%, a difference of 0.43%), Immigrants from Czechoslovakia (5.3%, a difference of 0.58%), and Immigrants from Greece (5.4%, a difference of 0.67%).
| Demographics | Rating | Rank | Single Mother Households |
| Immigrants | Korea | 99.7 /100 | #31 | Exceptional 5.3% |
| Cambodians | 99.7 /100 | #32 | Exceptional 5.3% |
| Immigrants | Switzerland | 99.7 /100 | #33 | Exceptional 5.3% |
| Bulgarians | 99.7 /100 | #34 | Exceptional 5.3% |
| Immigrants | Northern Europe | 99.7 /100 | #35 | Exceptional 5.3% |
| Immigrants | Czechoslovakia | 99.7 /100 | #36 | Exceptional 5.3% |
| Immigrants | Belgium | 99.7 /100 | #37 | Exceptional 5.3% |
| Immigrants | Serbia | 99.6 /100 | #38 | Exceptional 5.4% |
| Immigrants | Sweden | 99.6 /100 | #39 | Exceptional 5.4% |
| Estonians | 99.6 /100 | #40 | Exceptional 5.4% |
| Immigrants | Greece | 99.5 /100 | #41 | Exceptional 5.4% |
| Macedonians | 99.5 /100 | #42 | Exceptional 5.4% |
| Immigrants | South Central Asia | 99.5 /100 | #43 | Exceptional 5.4% |
| Lithuanians | 99.4 /100 | #44 | Exceptional 5.4% |
| Immigrants | Croatia | 99.4 /100 | #45 | Exceptional 5.4% |
Demographics Similar to Bermudans by Single Mother Households
In terms of single mother households, the demographic groups most similar to Bermudans are Immigrants from Africa (7.3%, a difference of 0.010%), Spanish American Indian (7.3%, a difference of 0.29%), Dutch West Indian (7.3%, a difference of 0.32%), Malaysian (7.3%, a difference of 0.36%), and Alaskan Athabascan (7.3%, a difference of 0.38%).
| Demographics | Rating | Rank | Single Mother Households |
| Fijians | 0.6 /100 | #242 | Tragic 7.2% |
| Ecuadorians | 0.6 /100 | #243 | Tragic 7.2% |
| Cubans | 0.6 /100 | #244 | Tragic 7.2% |
| Immigrants | Cambodia | 0.5 /100 | #245 | Tragic 7.2% |
| Nicaraguans | 0.5 /100 | #246 | Tragic 7.2% |
| Dutch West Indians | 0.4 /100 | #247 | Tragic 7.3% |
| Spanish American Indians | 0.4 /100 | #248 | Tragic 7.3% |
| Bermudans | 0.4 /100 | #249 | Tragic 7.3% |
| Immigrants | Africa | 0.4 /100 | #250 | Tragic 7.3% |
| Malaysians | 0.3 /100 | #251 | Tragic 7.3% |
| Alaskan Athabascans | 0.3 /100 | #252 | Tragic 7.3% |
| Cajuns | 0.3 /100 | #253 | Tragic 7.3% |
| Immigrants | Ecuador | 0.3 /100 | #254 | Tragic 7.3% |
| Mexican American Indians | 0.2 /100 | #255 | Tragic 7.4% |
| Seminole | 0.2 /100 | #256 | Tragic 7.4% |