Korean vs Bermudan Single Mother Households
COMPARE
Korean
Bermudan
Single Mother Households
Single Mother Households Comparison
Koreans
Bermudans
6.0%
SINGLE MOTHER HOUSEHOLDS
84.4/ 100
METRIC RATING
144th/ 347
METRIC RANK
7.3%
SINGLE MOTHER HOUSEHOLDS
0.4/ 100
METRIC RATING
249th/ 347
METRIC RANK
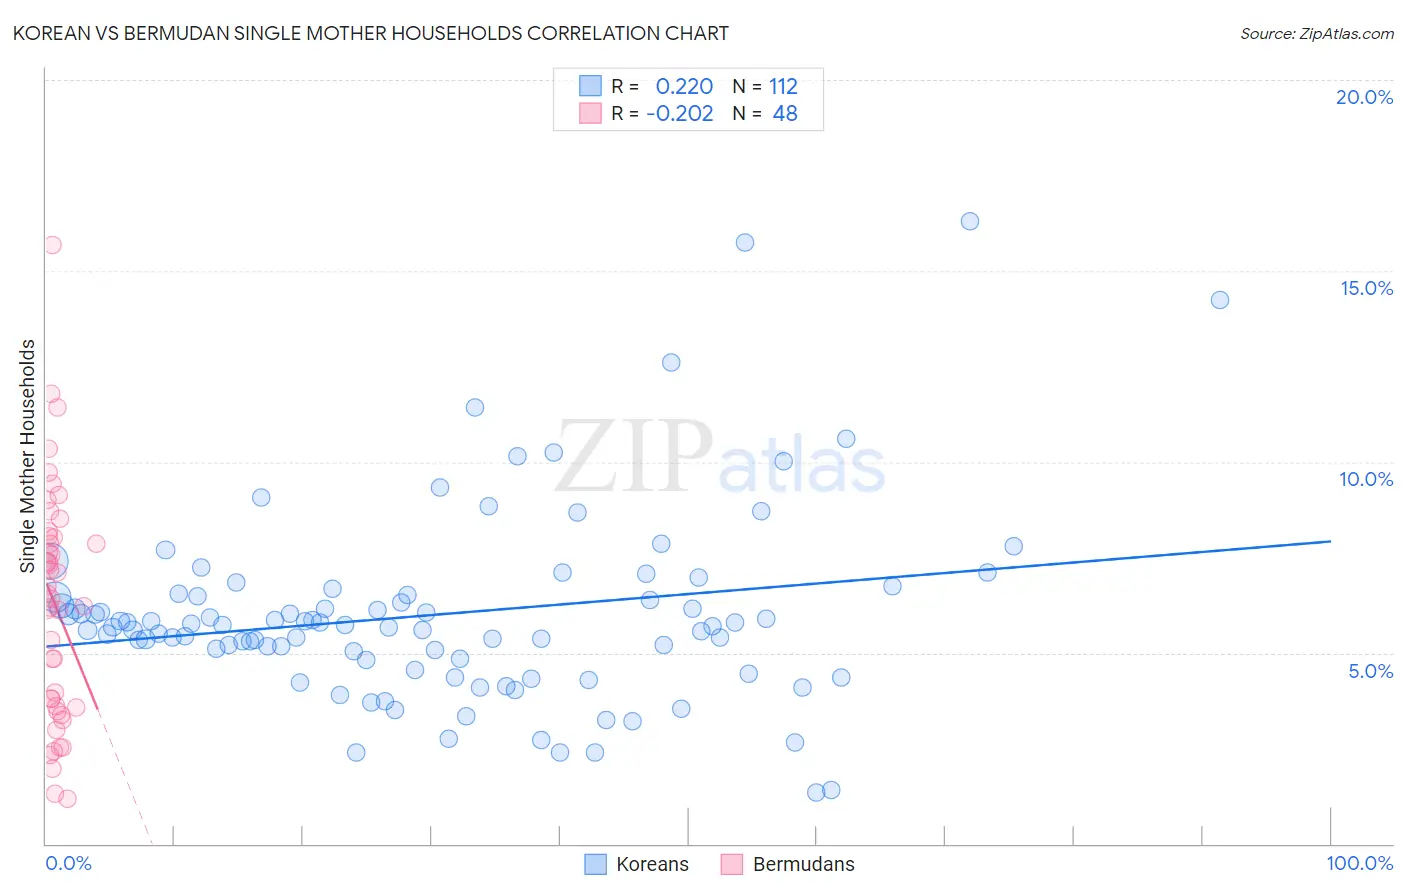
Korean vs Bermudan Single Mother Households Correlation Chart
The statistical analysis conducted on geographies consisting of 508,458,058 people shows a weak positive correlation between the proportion of Koreans and percentage of single mother households in the United States with a correlation coefficient (R) of 0.220 and weighted average of 6.0%. Similarly, the statistical analysis conducted on geographies consisting of 55,712,440 people shows a weak negative correlation between the proportion of Bermudans and percentage of single mother households in the United States with a correlation coefficient (R) of -0.202 and weighted average of 7.3%, a difference of 20.9%.
Single Mother Households Correlation Summary
| Measurement | Korean | Bermudan |
| Minimum | 1.4% | 1.2% |
| Maximum | 16.3% | 15.7% |
| Range | 14.9% | 14.5% |
| Mean | 6.0% | 6.3% |
| Median | 5.7% | 6.5% |
| Interquartile 25% (IQ1) | 4.8% | 3.6% |
| Interquartile 75% (IQ3) | 6.5% | 8.0% |
| Interquartile Range (IQR) | 1.7% | 4.5% |
| Standard Deviation (Sample) | 2.5% | 3.0% |
| Standard Deviation (Population) | 2.5% | 3.0% |
Similar Demographics by Single Mother Households
Demographics Similar to Koreans by Single Mother Households
In terms of single mother households, the demographic groups most similar to Koreans are Arab (6.0%, a difference of 0.090%), Immigrants from Iraq (6.0%, a difference of 0.10%), Immigrants from Egypt (6.0%, a difference of 0.14%), Tsimshian (6.0%, a difference of 0.19%), and French (6.0%, a difference of 0.29%).
| Demographics | Rating | Rank | Single Mother Households |
| Immigrants | Pakistan | 88.4 /100 | #137 | Excellent 6.0% |
| Icelanders | 86.9 /100 | #138 | Excellent 6.0% |
| Syrians | 86.0 /100 | #139 | Excellent 6.0% |
| French | 85.7 /100 | #140 | Excellent 6.0% |
| Tsimshian | 85.2 /100 | #141 | Excellent 6.0% |
| Immigrants | Egypt | 85.0 /100 | #142 | Excellent 6.0% |
| Immigrants | Iraq | 84.8 /100 | #143 | Excellent 6.0% |
| Koreans | 84.4 /100 | #144 | Excellent 6.0% |
| Arabs | 84.0 /100 | #145 | Excellent 6.0% |
| French Canadians | 82.6 /100 | #146 | Excellent 6.0% |
| Immigrants | Jordan | 82.3 /100 | #147 | Excellent 6.0% |
| Scotch-Irish | 82.0 /100 | #148 | Excellent 6.0% |
| Immigrants | Albania | 81.5 /100 | #149 | Excellent 6.1% |
| Zimbabweans | 80.7 /100 | #150 | Excellent 6.1% |
| Immigrants | Southern Europe | 80.5 /100 | #151 | Excellent 6.1% |
Demographics Similar to Bermudans by Single Mother Households
In terms of single mother households, the demographic groups most similar to Bermudans are Immigrants from Africa (7.3%, a difference of 0.010%), Spanish American Indian (7.3%, a difference of 0.29%), Dutch West Indian (7.3%, a difference of 0.32%), Malaysian (7.3%, a difference of 0.36%), and Alaskan Athabascan (7.3%, a difference of 0.38%).
| Demographics | Rating | Rank | Single Mother Households |
| Fijians | 0.6 /100 | #242 | Tragic 7.2% |
| Ecuadorians | 0.6 /100 | #243 | Tragic 7.2% |
| Cubans | 0.6 /100 | #244 | Tragic 7.2% |
| Immigrants | Cambodia | 0.5 /100 | #245 | Tragic 7.2% |
| Nicaraguans | 0.5 /100 | #246 | Tragic 7.2% |
| Dutch West Indians | 0.4 /100 | #247 | Tragic 7.3% |
| Spanish American Indians | 0.4 /100 | #248 | Tragic 7.3% |
| Bermudans | 0.4 /100 | #249 | Tragic 7.3% |
| Immigrants | Africa | 0.4 /100 | #250 | Tragic 7.3% |
| Malaysians | 0.3 /100 | #251 | Tragic 7.3% |
| Alaskan Athabascans | 0.3 /100 | #252 | Tragic 7.3% |
| Cajuns | 0.3 /100 | #253 | Tragic 7.3% |
| Immigrants | Ecuador | 0.3 /100 | #254 | Tragic 7.3% |
| Mexican American Indians | 0.2 /100 | #255 | Tragic 7.4% |
| Seminole | 0.2 /100 | #256 | Tragic 7.4% |