White/Caucasian vs Taiwanese Single Mother Households
COMPARE
White/Caucasian
Taiwanese
Single Mother Households
Single Mother Households Comparison
Whites/Caucasians
Taiwanese
6.1%
SINGLE MOTHER HOUSEHOLDS
76.5/ 100
METRIC RATING
155th/ 347
METRIC RANK
5.8%
SINGLE MOTHER HOUSEHOLDS
96.1/ 100
METRIC RATING
105th/ 347
METRIC RANK
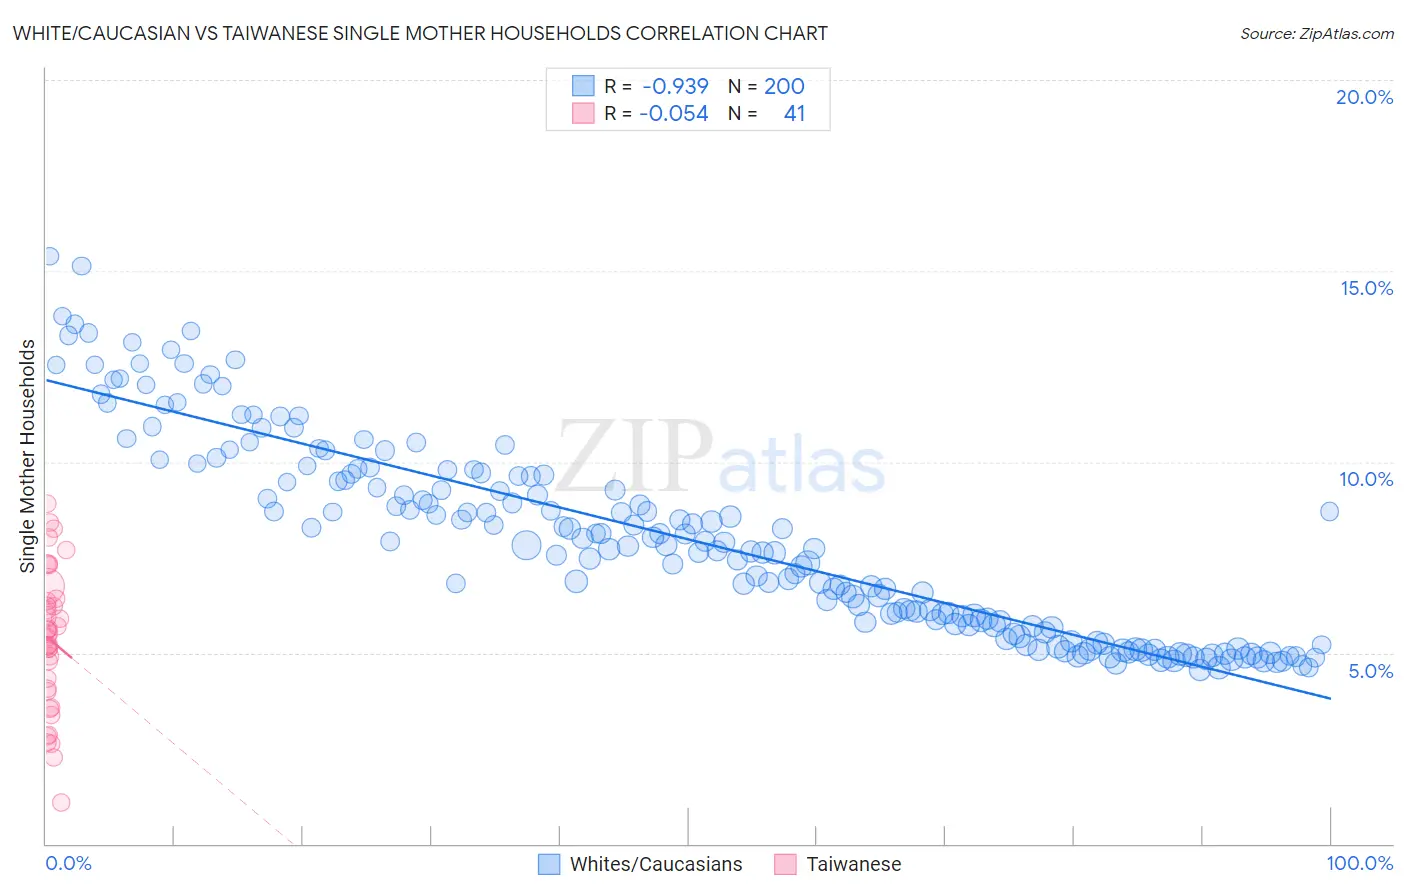
White/Caucasian vs Taiwanese Single Mother Households Correlation Chart
The statistical analysis conducted on geographies consisting of 577,516,213 people shows a near-perfect negative correlation between the proportion of Whites/Caucasians and percentage of single mother households in the United States with a correlation coefficient (R) of -0.939 and weighted average of 6.1%. Similarly, the statistical analysis conducted on geographies consisting of 31,687,013 people shows a slight negative correlation between the proportion of Taiwanese and percentage of single mother households in the United States with a correlation coefficient (R) of -0.054 and weighted average of 5.8%, a difference of 6.0%.
Single Mother Households Correlation Summary
| Measurement | White/Caucasian | Taiwanese |
| Minimum | 4.6% | 1.1% |
| Maximum | 15.4% | 8.9% |
| Range | 10.8% | 7.8% |
| Mean | 8.0% | 5.3% |
| Median | 7.8% | 5.5% |
| Interquartile 25% (IQ1) | 5.7% | 4.0% |
| Interquartile 75% (IQ3) | 9.7% | 6.4% |
| Interquartile Range (IQR) | 4.0% | 2.4% |
| Standard Deviation (Sample) | 2.6% | 1.8% |
| Standard Deviation (Population) | 2.6% | 1.8% |
Similar Demographics by Single Mother Households
Demographics Similar to Whites/Caucasians by Single Mother Households
In terms of single mother households, the demographic groups most similar to Whites/Caucasians are Native Hawaiian (6.1%, a difference of 0.23%), Immigrants from Philippines (6.1%, a difference of 0.33%), Chilean (6.1%, a difference of 0.34%), Immigrants from Brazil (6.1%, a difference of 0.40%), and Pakistani (6.1%, a difference of 0.44%).
| Demographics | Rating | Rank | Single Mother Households |
| Scotch-Irish | 82.0 /100 | #148 | Excellent 6.0% |
| Immigrants | Albania | 81.5 /100 | #149 | Excellent 6.1% |
| Zimbabweans | 80.7 /100 | #150 | Excellent 6.1% |
| Immigrants | Southern Europe | 80.5 /100 | #151 | Excellent 6.1% |
| Pakistanis | 79.2 /100 | #152 | Good 6.1% |
| Immigrants | Brazil | 78.9 /100 | #153 | Good 6.1% |
| Immigrants | Philippines | 78.5 /100 | #154 | Good 6.1% |
| Whites/Caucasians | 76.5 /100 | #155 | Good 6.1% |
| Native Hawaiians | 75.0 /100 | #156 | Good 6.1% |
| Chileans | 74.2 /100 | #157 | Good 6.1% |
| Celtics | 73.3 /100 | #158 | Good 6.1% |
| Yugoslavians | 73.1 /100 | #159 | Good 6.1% |
| Iraqis | 73.0 /100 | #160 | Good 6.1% |
| Immigrants | Germany | 72.4 /100 | #161 | Good 6.1% |
| Immigrants | Zimbabwe | 69.9 /100 | #162 | Good 6.2% |
Demographics Similar to Taiwanese by Single Mother Households
In terms of single mother households, the demographic groups most similar to Taiwanese are Northern European (5.8%, a difference of 0.070%), Scottish (5.8%, a difference of 0.080%), German (5.8%, a difference of 0.10%), English (5.8%, a difference of 0.10%), and Immigrants from Ukraine (5.8%, a difference of 0.10%).
| Demographics | Rating | Rank | Single Mother Households |
| Immigrants | South Africa | 96.3 /100 | #98 | Exceptional 5.7% |
| Immigrants | Poland | 96.3 /100 | #99 | Exceptional 5.8% |
| Scandinavians | 96.2 /100 | #100 | Exceptional 5.8% |
| Germans | 96.2 /100 | #101 | Exceptional 5.8% |
| English | 96.2 /100 | #102 | Exceptional 5.8% |
| Scottish | 96.2 /100 | #103 | Exceptional 5.8% |
| Northern Europeans | 96.2 /100 | #104 | Exceptional 5.8% |
| Taiwanese | 96.1 /100 | #105 | Exceptional 5.8% |
| Immigrants | Ukraine | 95.9 /100 | #106 | Exceptional 5.8% |
| Paraguayans | 95.8 /100 | #107 | Exceptional 5.8% |
| Immigrants | Italy | 95.8 /100 | #108 | Exceptional 5.8% |
| Immigrants | Western Europe | 95.7 /100 | #109 | Exceptional 5.8% |
| British | 95.5 /100 | #110 | Exceptional 5.8% |
| Immigrants | England | 95.5 /100 | #111 | Exceptional 5.8% |
| Immigrants | Kuwait | 95.4 /100 | #112 | Exceptional 5.8% |