White/Caucasian vs Immigrants from Latvia Single Mother Households
COMPARE
White/Caucasian
Immigrants from Latvia
Single Mother Households
Single Mother Households Comparison
Whites/Caucasians
Immigrants from Latvia
6.1%
SINGLE MOTHER HOUSEHOLDS
76.5/ 100
METRIC RATING
155th/ 347
METRIC RANK
5.5%
SINGLE MOTHER HOUSEHOLDS
99.2/ 100
METRIC RATING
49th/ 347
METRIC RANK
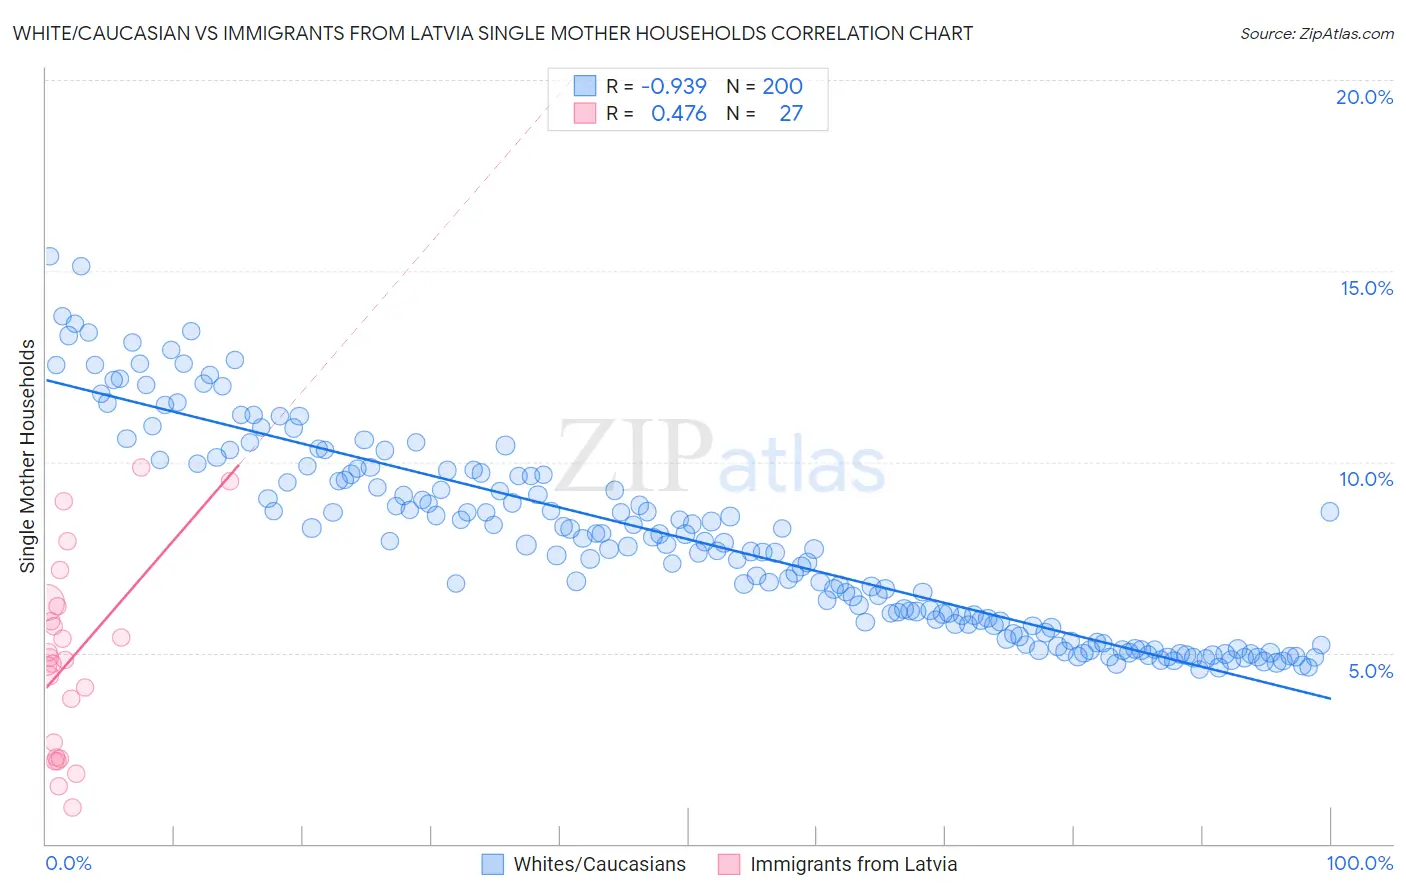
White/Caucasian vs Immigrants from Latvia Single Mother Households Correlation Chart
The statistical analysis conducted on geographies consisting of 577,516,213 people shows a near-perfect negative correlation between the proportion of Whites/Caucasians and percentage of single mother households in the United States with a correlation coefficient (R) of -0.939 and weighted average of 6.1%. Similarly, the statistical analysis conducted on geographies consisting of 113,660,661 people shows a moderate positive correlation between the proportion of Immigrants from Latvia and percentage of single mother households in the United States with a correlation coefficient (R) of 0.476 and weighted average of 5.5%, a difference of 11.5%.
Single Mother Households Correlation Summary
| Measurement | White/Caucasian | Immigrants from Latvia |
| Minimum | 4.6% | 0.94% |
| Maximum | 15.4% | 9.9% |
| Range | 10.8% | 8.9% |
| Mean | 8.0% | 4.8% |
| Median | 7.8% | 4.8% |
| Interquartile 25% (IQ1) | 5.7% | 2.3% |
| Interquartile 75% (IQ3) | 9.7% | 6.2% |
| Interquartile Range (IQR) | 4.0% | 4.0% |
| Standard Deviation (Sample) | 2.6% | 2.4% |
| Standard Deviation (Population) | 2.6% | 2.4% |
Similar Demographics by Single Mother Households
Demographics Similar to Whites/Caucasians by Single Mother Households
In terms of single mother households, the demographic groups most similar to Whites/Caucasians are Native Hawaiian (6.1%, a difference of 0.23%), Immigrants from Philippines (6.1%, a difference of 0.33%), Chilean (6.1%, a difference of 0.34%), Immigrants from Brazil (6.1%, a difference of 0.40%), and Pakistani (6.1%, a difference of 0.44%).
| Demographics | Rating | Rank | Single Mother Households |
| Scotch-Irish | 82.0 /100 | #148 | Excellent 6.0% |
| Immigrants | Albania | 81.5 /100 | #149 | Excellent 6.1% |
| Zimbabweans | 80.7 /100 | #150 | Excellent 6.1% |
| Immigrants | Southern Europe | 80.5 /100 | #151 | Excellent 6.1% |
| Pakistanis | 79.2 /100 | #152 | Good 6.1% |
| Immigrants | Brazil | 78.9 /100 | #153 | Good 6.1% |
| Immigrants | Philippines | 78.5 /100 | #154 | Good 6.1% |
| Whites/Caucasians | 76.5 /100 | #155 | Good 6.1% |
| Native Hawaiians | 75.0 /100 | #156 | Good 6.1% |
| Chileans | 74.2 /100 | #157 | Good 6.1% |
| Celtics | 73.3 /100 | #158 | Good 6.1% |
| Yugoslavians | 73.1 /100 | #159 | Good 6.1% |
| Iraqis | 73.0 /100 | #160 | Good 6.1% |
| Immigrants | Germany | 72.4 /100 | #161 | Good 6.1% |
| Immigrants | Zimbabwe | 69.9 /100 | #162 | Good 6.2% |
Demographics Similar to Immigrants from Latvia by Single Mother Households
In terms of single mother households, the demographic groups most similar to Immigrants from Latvia are Turkish (5.5%, a difference of 0.030%), Immigrants from Scotland (5.5%, a difference of 0.19%), Immigrants from Belarus (5.5%, a difference of 0.21%), Norwegian (5.5%, a difference of 0.23%), and Swedish (5.5%, a difference of 0.27%).
| Demographics | Rating | Rank | Single Mother Households |
| Macedonians | 99.5 /100 | #42 | Exceptional 5.4% |
| Immigrants | South Central Asia | 99.5 /100 | #43 | Exceptional 5.4% |
| Lithuanians | 99.4 /100 | #44 | Exceptional 5.4% |
| Immigrants | Croatia | 99.4 /100 | #45 | Exceptional 5.4% |
| Croatians | 99.3 /100 | #46 | Exceptional 5.5% |
| Norwegians | 99.3 /100 | #47 | Exceptional 5.5% |
| Turks | 99.2 /100 | #48 | Exceptional 5.5% |
| Immigrants | Latvia | 99.2 /100 | #49 | Exceptional 5.5% |
| Immigrants | Scotland | 99.2 /100 | #50 | Exceptional 5.5% |
| Immigrants | Belarus | 99.2 /100 | #51 | Exceptional 5.5% |
| Swedes | 99.1 /100 | #52 | Exceptional 5.5% |
| Immigrants | Russia | 99.1 /100 | #53 | Exceptional 5.5% |
| Immigrants | Lebanon | 99.1 /100 | #54 | Exceptional 5.5% |
| Immigrants | Denmark | 99.1 /100 | #55 | Exceptional 5.5% |
| Immigrants | Romania | 99.0 /100 | #56 | Exceptional 5.5% |