Portuguese vs Bermudan Single Mother Households
COMPARE
Portuguese
Bermudan
Single Mother Households
Single Mother Households Comparison
Portuguese
Bermudans
6.4%
SINGLE MOTHER HOUSEHOLDS
40.0/ 100
METRIC RATING
178th/ 347
METRIC RANK
7.3%
SINGLE MOTHER HOUSEHOLDS
0.4/ 100
METRIC RATING
249th/ 347
METRIC RANK
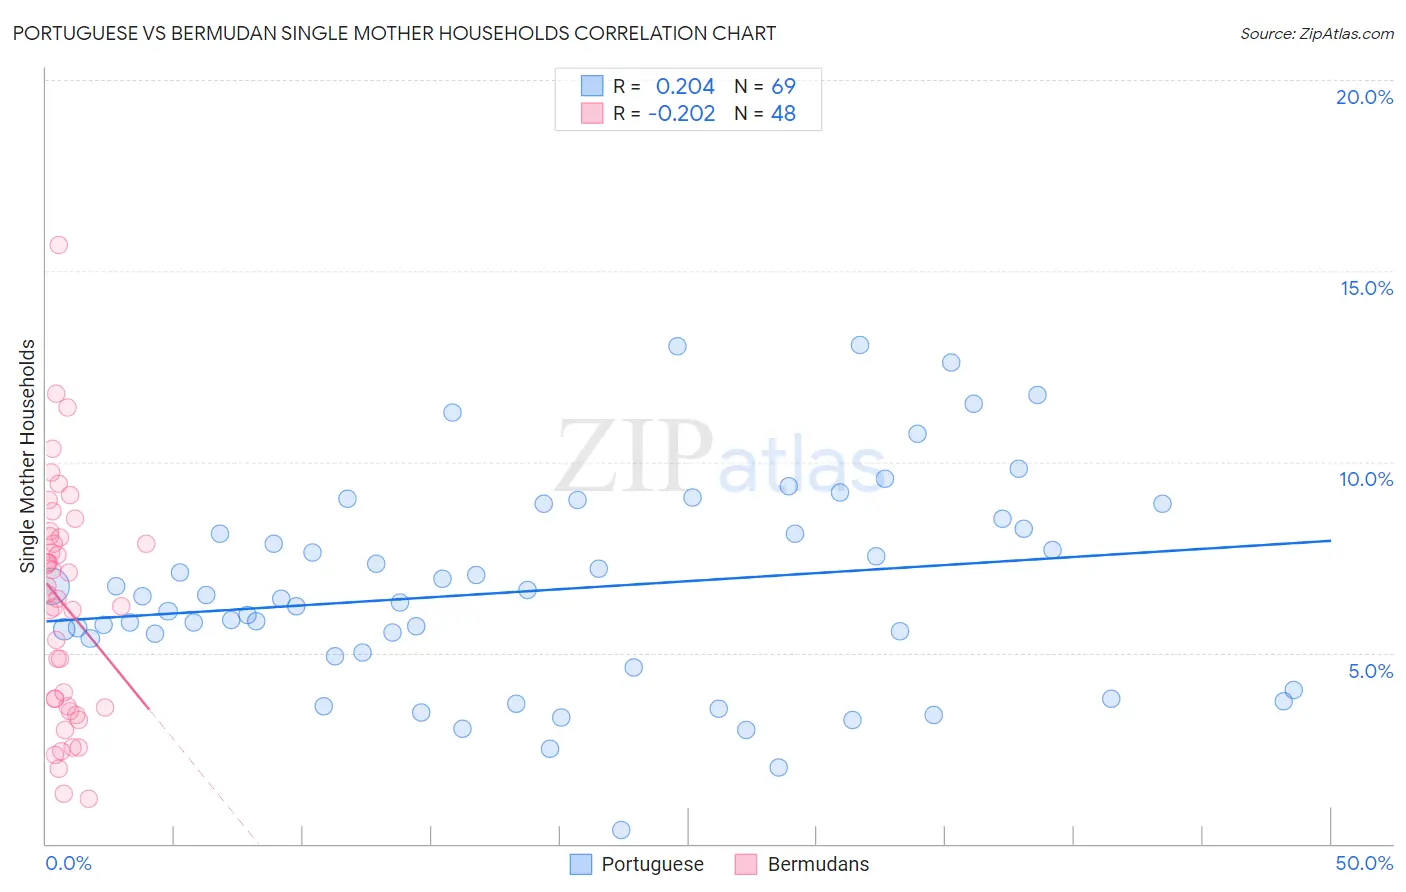
Portuguese vs Bermudan Single Mother Households Correlation Chart
The statistical analysis conducted on geographies consisting of 448,231,637 people shows a weak positive correlation between the proportion of Portuguese and percentage of single mother households in the United States with a correlation coefficient (R) of 0.204 and weighted average of 6.4%. Similarly, the statistical analysis conducted on geographies consisting of 55,712,440 people shows a weak negative correlation between the proportion of Bermudans and percentage of single mother households in the United States with a correlation coefficient (R) of -0.202 and weighted average of 7.3%, a difference of 14.1%.
Single Mother Households Correlation Summary
| Measurement | Portuguese | Bermudan |
| Minimum | 0.35% | 1.2% |
| Maximum | 13.1% | 15.7% |
| Range | 12.7% | 14.5% |
| Mean | 6.7% | 6.3% |
| Median | 6.4% | 6.5% |
| Interquartile 25% (IQ1) | 5.0% | 3.6% |
| Interquartile 75% (IQ3) | 8.4% | 8.0% |
| Interquartile Range (IQR) | 3.4% | 4.5% |
| Standard Deviation (Sample) | 2.7% | 3.0% |
| Standard Deviation (Population) | 2.7% | 3.0% |
Similar Demographics by Single Mother Households
Demographics Similar to Portuguese by Single Mother Households
In terms of single mother households, the demographic groups most similar to Portuguese are Hmong (6.4%, a difference of 0.020%), Osage (6.4%, a difference of 0.34%), Immigrants from Nepal (6.4%, a difference of 0.45%), Immigrants from Bosnia and Herzegovina (6.3%, a difference of 0.49%), and Marshallese (6.3%, a difference of 0.65%).
| Demographics | Rating | Rank | Single Mother Households |
| Afghans | 52.5 /100 | #171 | Average 6.3% |
| Immigrants | South Eastern Asia | 52.2 /100 | #172 | Average 6.3% |
| Immigrants | Vietnam | 51.5 /100 | #173 | Average 6.3% |
| Immigrants | Morocco | 50.0 /100 | #174 | Average 6.3% |
| Marshallese | 45.8 /100 | #175 | Average 6.3% |
| Immigrants | Bosnia and Herzegovina | 44.3 /100 | #176 | Average 6.3% |
| Osage | 43.0 /100 | #177 | Average 6.4% |
| Portuguese | 40.0 /100 | #178 | Fair 6.4% |
| Hmong | 39.8 /100 | #179 | Fair 6.4% |
| Immigrants | Nepal | 36.1 /100 | #180 | Fair 6.4% |
| Spanish | 33.4 /100 | #181 | Fair 6.4% |
| South American Indians | 33.4 /100 | #182 | Fair 6.4% |
| Spaniards | 27.8 /100 | #183 | Fair 6.5% |
| Ethiopians | 26.0 /100 | #184 | Fair 6.5% |
| Ugandans | 25.6 /100 | #185 | Fair 6.5% |
Demographics Similar to Bermudans by Single Mother Households
In terms of single mother households, the demographic groups most similar to Bermudans are Immigrants from Africa (7.3%, a difference of 0.010%), Spanish American Indian (7.3%, a difference of 0.29%), Dutch West Indian (7.3%, a difference of 0.32%), Malaysian (7.3%, a difference of 0.36%), and Alaskan Athabascan (7.3%, a difference of 0.38%).
| Demographics | Rating | Rank | Single Mother Households |
| Fijians | 0.6 /100 | #242 | Tragic 7.2% |
| Ecuadorians | 0.6 /100 | #243 | Tragic 7.2% |
| Cubans | 0.6 /100 | #244 | Tragic 7.2% |
| Immigrants | Cambodia | 0.5 /100 | #245 | Tragic 7.2% |
| Nicaraguans | 0.5 /100 | #246 | Tragic 7.2% |
| Dutch West Indians | 0.4 /100 | #247 | Tragic 7.3% |
| Spanish American Indians | 0.4 /100 | #248 | Tragic 7.3% |
| Bermudans | 0.4 /100 | #249 | Tragic 7.3% |
| Immigrants | Africa | 0.4 /100 | #250 | Tragic 7.3% |
| Malaysians | 0.3 /100 | #251 | Tragic 7.3% |
| Alaskan Athabascans | 0.3 /100 | #252 | Tragic 7.3% |
| Cajuns | 0.3 /100 | #253 | Tragic 7.3% |
| Immigrants | Ecuador | 0.3 /100 | #254 | Tragic 7.3% |
| Mexican American Indians | 0.2 /100 | #255 | Tragic 7.4% |
| Seminole | 0.2 /100 | #256 | Tragic 7.4% |