Moroccan vs Bermudan Single Mother Households
COMPARE
Moroccan
Bermudan
Single Mother Households
Single Mother Households Comparison
Moroccans
Bermudans
6.6%
SINGLE MOTHER HOUSEHOLDS
17.4/ 100
METRIC RATING
197th/ 347
METRIC RANK
7.3%
SINGLE MOTHER HOUSEHOLDS
0.4/ 100
METRIC RATING
249th/ 347
METRIC RANK
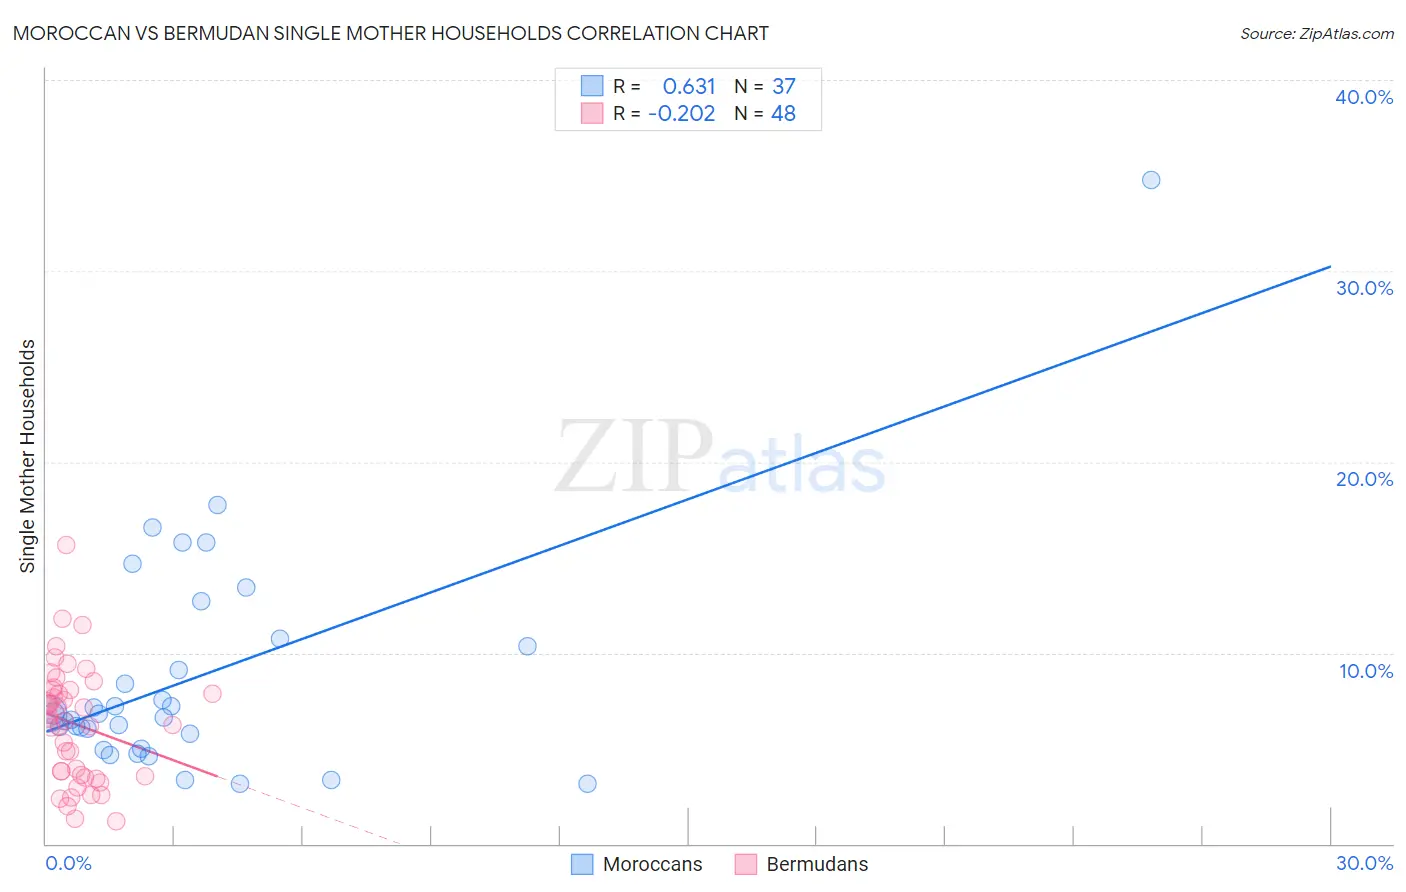
Moroccan vs Bermudan Single Mother Households Correlation Chart
The statistical analysis conducted on geographies consisting of 201,586,656 people shows a significant positive correlation between the proportion of Moroccans and percentage of single mother households in the United States with a correlation coefficient (R) of 0.631 and weighted average of 6.6%. Similarly, the statistical analysis conducted on geographies consisting of 55,712,440 people shows a weak negative correlation between the proportion of Bermudans and percentage of single mother households in the United States with a correlation coefficient (R) of -0.202 and weighted average of 7.3%, a difference of 10.7%.
Single Mother Households Correlation Summary
| Measurement | Moroccan | Bermudan |
| Minimum | 3.1% | 1.2% |
| Maximum | 34.7% | 15.7% |
| Range | 31.6% | 14.5% |
| Mean | 8.7% | 6.3% |
| Median | 6.8% | 6.5% |
| Interquartile 25% (IQ1) | 5.4% | 3.6% |
| Interquartile 75% (IQ3) | 10.6% | 8.0% |
| Interquartile Range (IQR) | 5.2% | 4.5% |
| Standard Deviation (Sample) | 5.9% | 3.0% |
| Standard Deviation (Population) | 5.9% | 3.0% |
Similar Demographics by Single Mother Households
Demographics Similar to Moroccans by Single Mother Households
In terms of single mother households, the demographic groups most similar to Moroccans are South American (6.6%, a difference of 0.11%), Uruguayan (6.6%, a difference of 0.11%), Immigrants from Uganda (6.6%, a difference of 0.15%), Colombian (6.6%, a difference of 0.16%), and Hawaiian (6.6%, a difference of 0.25%).
| Demographics | Rating | Rank | Single Mother Households |
| Peruvians | 21.6 /100 | #190 | Fair 6.5% |
| Samoans | 21.2 /100 | #191 | Fair 6.5% |
| Americans | 19.0 /100 | #192 | Poor 6.6% |
| Colombians | 18.3 /100 | #193 | Poor 6.6% |
| Immigrants | Uganda | 18.3 /100 | #194 | Poor 6.6% |
| South Americans | 18.0 /100 | #195 | Poor 6.6% |
| Uruguayans | 18.0 /100 | #196 | Poor 6.6% |
| Moroccans | 17.4 /100 | #197 | Poor 6.6% |
| Hawaiians | 16.1 /100 | #198 | Poor 6.6% |
| Potawatomi | 15.5 /100 | #199 | Poor 6.6% |
| Immigrants | Ethiopia | 14.7 /100 | #200 | Poor 6.6% |
| Venezuelans | 12.9 /100 | #201 | Poor 6.6% |
| Guamanians/Chamorros | 12.4 /100 | #202 | Poor 6.6% |
| Immigrants | Peru | 12.0 /100 | #203 | Poor 6.7% |
| Immigrants | Fiji | 11.9 /100 | #204 | Poor 6.7% |
Demographics Similar to Bermudans by Single Mother Households
In terms of single mother households, the demographic groups most similar to Bermudans are Immigrants from Africa (7.3%, a difference of 0.010%), Spanish American Indian (7.3%, a difference of 0.29%), Dutch West Indian (7.3%, a difference of 0.32%), Malaysian (7.3%, a difference of 0.36%), and Alaskan Athabascan (7.3%, a difference of 0.38%).
| Demographics | Rating | Rank | Single Mother Households |
| Fijians | 0.6 /100 | #242 | Tragic 7.2% |
| Ecuadorians | 0.6 /100 | #243 | Tragic 7.2% |
| Cubans | 0.6 /100 | #244 | Tragic 7.2% |
| Immigrants | Cambodia | 0.5 /100 | #245 | Tragic 7.2% |
| Nicaraguans | 0.5 /100 | #246 | Tragic 7.2% |
| Dutch West Indians | 0.4 /100 | #247 | Tragic 7.3% |
| Spanish American Indians | 0.4 /100 | #248 | Tragic 7.3% |
| Bermudans | 0.4 /100 | #249 | Tragic 7.3% |
| Immigrants | Africa | 0.4 /100 | #250 | Tragic 7.3% |
| Malaysians | 0.3 /100 | #251 | Tragic 7.3% |
| Alaskan Athabascans | 0.3 /100 | #252 | Tragic 7.3% |
| Cajuns | 0.3 /100 | #253 | Tragic 7.3% |
| Immigrants | Ecuador | 0.3 /100 | #254 | Tragic 7.3% |
| Mexican American Indians | 0.2 /100 | #255 | Tragic 7.4% |
| Seminole | 0.2 /100 | #256 | Tragic 7.4% |