Welsh vs Immigrants from Germany Single Mother Households
COMPARE
Welsh
Immigrants from Germany
Single Mother Households
Single Mother Households Comparison
Welsh
Immigrants from Germany
5.9%
SINGLE MOTHER HOUSEHOLDS
92.8/ 100
METRIC RATING
126th/ 347
METRIC RANK
6.1%
SINGLE MOTHER HOUSEHOLDS
72.4/ 100
METRIC RATING
161st/ 347
METRIC RANK
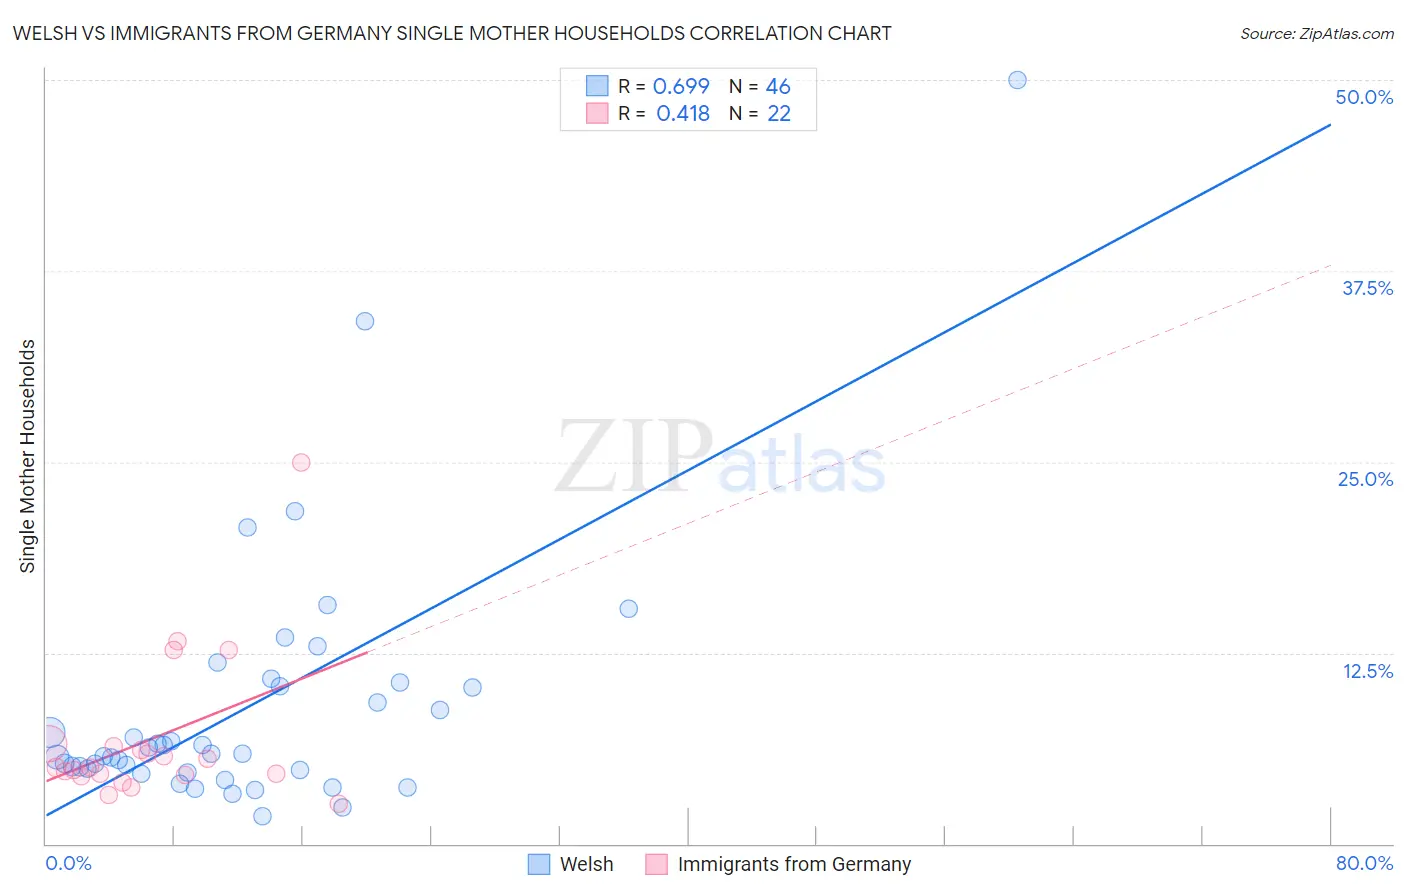
Welsh vs Immigrants from Germany Single Mother Households Correlation Chart
The statistical analysis conducted on geographies consisting of 524,967,910 people shows a significant positive correlation between the proportion of Welsh and percentage of single mother households in the United States with a correlation coefficient (R) of 0.699 and weighted average of 5.9%. Similarly, the statistical analysis conducted on geographies consisting of 462,130,920 people shows a moderate positive correlation between the proportion of Immigrants from Germany and percentage of single mother households in the United States with a correlation coefficient (R) of 0.418 and weighted average of 6.1%, a difference of 4.7%.
Single Mother Households Correlation Summary
| Measurement | Welsh | Immigrants from Germany |
| Minimum | 1.8% | 2.6% |
| Maximum | 50.0% | 25.0% |
| Range | 48.2% | 22.4% |
| Mean | 9.0% | 6.9% |
| Median | 5.9% | 5.0% |
| Interquartile 25% (IQ1) | 4.8% | 4.5% |
| Interquartile 75% (IQ3) | 10.3% | 6.4% |
| Interquartile Range (IQR) | 5.5% | 1.9% |
| Standard Deviation (Sample) | 8.6% | 5.0% |
| Standard Deviation (Population) | 8.5% | 4.9% |
Similar Demographics by Single Mother Households
Demographics Similar to Welsh by Single Mother Households
In terms of single mother households, the demographic groups most similar to Welsh are Slavic (5.9%, a difference of 0.020%), Immigrants from Argentina (5.9%, a difference of 0.18%), Lebanese (5.9%, a difference of 0.19%), Immigrants from Uzbekistan (5.9%, a difference of 0.25%), and Czechoslovakian (5.9%, a difference of 0.27%).
| Demographics | Rating | Rank | Single Mother Households |
| South Africans | 94.1 /100 | #119 | Exceptional 5.8% |
| Tongans | 93.7 /100 | #120 | Exceptional 5.8% |
| Argentineans | 93.7 /100 | #121 | Exceptional 5.8% |
| Belgians | 93.5 /100 | #122 | Exceptional 5.8% |
| Immigrants | Uzbekistan | 93.4 /100 | #123 | Exceptional 5.9% |
| Immigrants | Argentina | 93.2 /100 | #124 | Exceptional 5.9% |
| Slavs | 92.9 /100 | #125 | Exceptional 5.9% |
| Welsh | 92.8 /100 | #126 | Exceptional 5.9% |
| Lebanese | 92.4 /100 | #127 | Exceptional 5.9% |
| Czechoslovakians | 92.2 /100 | #128 | Exceptional 5.9% |
| Immigrants | Bolivia | 92.2 /100 | #129 | Exceptional 5.9% |
| Palestinians | 92.1 /100 | #130 | Exceptional 5.9% |
| Immigrants | Spain | 91.2 /100 | #131 | Exceptional 5.9% |
| Albanians | 91.1 /100 | #132 | Exceptional 5.9% |
| Egyptians | 90.7 /100 | #133 | Exceptional 5.9% |
Demographics Similar to Immigrants from Germany by Single Mother Households
In terms of single mother households, the demographic groups most similar to Immigrants from Germany are Iraqi (6.1%, a difference of 0.080%), Yugoslavian (6.1%, a difference of 0.090%), Celtic (6.1%, a difference of 0.13%), Chilean (6.1%, a difference of 0.27%), and Immigrants from Zimbabwe (6.2%, a difference of 0.34%).
| Demographics | Rating | Rank | Single Mother Households |
| Immigrants | Philippines | 78.5 /100 | #154 | Good 6.1% |
| Whites/Caucasians | 76.5 /100 | #155 | Good 6.1% |
| Native Hawaiians | 75.0 /100 | #156 | Good 6.1% |
| Chileans | 74.2 /100 | #157 | Good 6.1% |
| Celtics | 73.3 /100 | #158 | Good 6.1% |
| Yugoslavians | 73.1 /100 | #159 | Good 6.1% |
| Iraqis | 73.0 /100 | #160 | Good 6.1% |
| Immigrants | Germany | 72.4 /100 | #161 | Good 6.1% |
| Immigrants | Zimbabwe | 69.9 /100 | #162 | Good 6.2% |
| Alsatians | 68.7 /100 | #163 | Good 6.2% |
| Immigrants | Northern Africa | 68.0 /100 | #164 | Good 6.2% |
| Immigrants | Syria | 67.4 /100 | #165 | Good 6.2% |
| Sri Lankans | 63.9 /100 | #166 | Good 6.2% |
| Brazilians | 59.1 /100 | #167 | Average 6.2% |
| Immigrants | Chile | 58.3 /100 | #168 | Average 6.3% |