Uruguayan vs Italian Average Family Size
COMPARE
Uruguayan
Italian
Average Family Size
Average Family Size Comparison
Uruguayans
Italians
3.23
AVERAGE FAMILY SIZE
58.8/ 100
METRIC RATING
163rd/ 347
METRIC RANK
3.12
AVERAGE FAMILY SIZE
0.1/ 100
METRIC RATING
317th/ 347
METRIC RANK
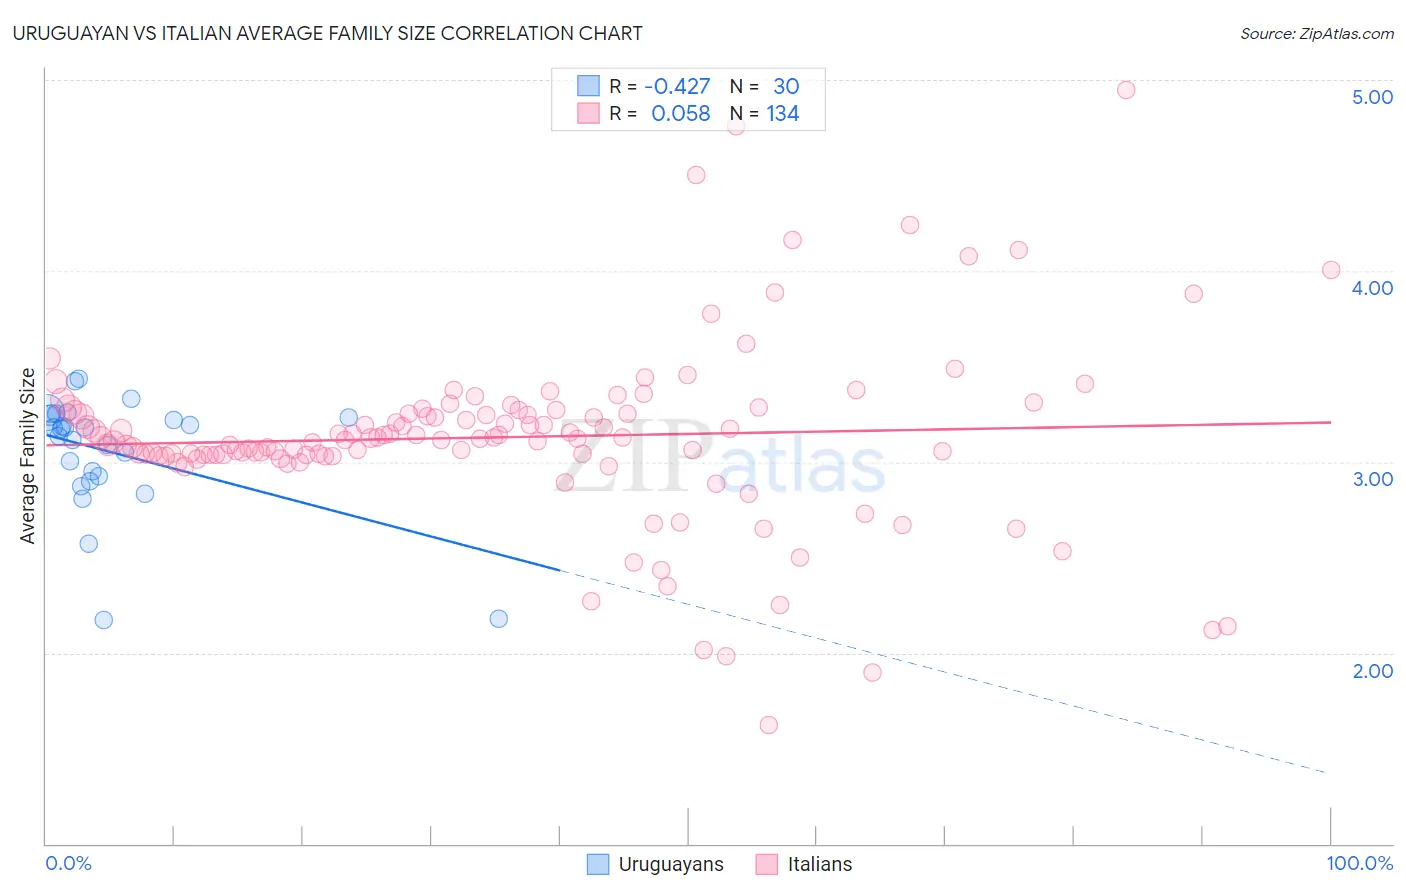
Uruguayan vs Italian Average Family Size Correlation Chart
The statistical analysis conducted on geographies consisting of 144,757,082 people shows a moderate negative correlation between the proportion of Uruguayans and average family size in the United States with a correlation coefficient (R) of -0.427 and weighted average of 3.23. Similarly, the statistical analysis conducted on geographies consisting of 574,452,986 people shows a slight positive correlation between the proportion of Italians and average family size in the United States with a correlation coefficient (R) of 0.058 and weighted average of 3.12, a difference of 3.7%.
Average Family Size Correlation Summary
| Measurement | Uruguayan | Italian |
| Minimum | 2.17 | 1.62 |
| Maximum | 3.44 | 4.95 |
| Range | 1.27 | 3.33 |
| Mean | 3.05 | 3.13 |
| Median | 3.17 | 3.12 |
| Interquartile 25% (IQ1) | 2.92 | 3.04 |
| Interquartile 75% (IQ3) | 3.24 | 3.26 |
| Interquartile Range (IQR) | 0.32 | 0.22 |
| Standard Deviation (Sample) | 0.31 | 0.47 |
| Standard Deviation (Population) | 0.30 | 0.47 |
Similar Demographics by Average Family Size
Demographics Similar to Uruguayans by Average Family Size
In terms of average family size, the demographic groups most similar to Uruguayans are Egyptian (3.23, a difference of 0.0%), Ugandan (3.23, a difference of 0.010%), Immigrants from Uganda (3.23, a difference of 0.020%), Immigrants from Senegal (3.23, a difference of 0.030%), and Dutch West Indian (3.23, a difference of 0.040%).
| Demographics | Rating | Rank | Average Family Size |
| Immigrants | Taiwan | 68.1 /100 | #156 | Good 3.24 |
| Immigrants | Uzbekistan | 67.0 /100 | #157 | Good 3.24 |
| Iraqis | 64.3 /100 | #158 | Good 3.24 |
| Ethiopians | 63.9 /100 | #159 | Good 3.24 |
| Immigrants | Iraq | 63.7 /100 | #160 | Good 3.24 |
| Immigrants | Chile | 63.2 /100 | #161 | Good 3.24 |
| Immigrants | Uganda | 60.1 /100 | #162 | Good 3.23 |
| Uruguayans | 58.8 /100 | #163 | Average 3.23 |
| Egyptians | 58.6 /100 | #164 | Average 3.23 |
| Ugandans | 58.4 /100 | #165 | Average 3.23 |
| Immigrants | Senegal | 57.5 /100 | #166 | Average 3.23 |
| Dutch West Indians | 56.9 /100 | #167 | Average 3.23 |
| Taiwanese | 54.2 /100 | #168 | Average 3.23 |
| Aleuts | 54.1 /100 | #169 | Average 3.23 |
| Arabs | 53.8 /100 | #170 | Average 3.23 |
Demographics Similar to Italians by Average Family Size
In terms of average family size, the demographic groups most similar to Italians are Eastern European (3.12, a difference of 0.010%), Welsh (3.12, a difference of 0.010%), Serbian (3.12, a difference of 0.060%), Immigrants from North America (3.12, a difference of 0.080%), and Immigrants from Austria (3.12, a difference of 0.11%).
| Demographics | Rating | Rank | Average Family Size |
| Czechoslovakians | 0.1 /100 | #310 | Tragic 3.13 |
| Immigrants | Northern Europe | 0.1 /100 | #311 | Tragic 3.13 |
| Immigrants | Australia | 0.1 /100 | #312 | Tragic 3.13 |
| Bulgarians | 0.1 /100 | #313 | Tragic 3.13 |
| Russians | 0.1 /100 | #314 | Tragic 3.12 |
| Immigrants | Scotland | 0.1 /100 | #315 | Tragic 3.12 |
| Serbians | 0.1 /100 | #316 | Tragic 3.12 |
| Italians | 0.1 /100 | #317 | Tragic 3.12 |
| Eastern Europeans | 0.1 /100 | #318 | Tragic 3.12 |
| Welsh | 0.1 /100 | #319 | Tragic 3.12 |
| Immigrants | North America | 0.0 /100 | #320 | Tragic 3.12 |
| Immigrants | Austria | 0.0 /100 | #321 | Tragic 3.12 |
| Immigrants | Canada | 0.0 /100 | #322 | Tragic 3.12 |
| Soviet Union | 0.0 /100 | #323 | Tragic 3.11 |
| Celtics | 0.0 /100 | #324 | Tragic 3.11 |