Uruguayan vs Korean Average Family Size
COMPARE
Uruguayan
Korean
Average Family Size
Average Family Size Comparison
Uruguayans
Koreans
3.23
AVERAGE FAMILY SIZE
58.8/ 100
METRIC RATING
163rd/ 347
METRIC RANK
3.36
AVERAGE FAMILY SIZE
100.0/ 100
METRIC RATING
53rd/ 347
METRIC RANK
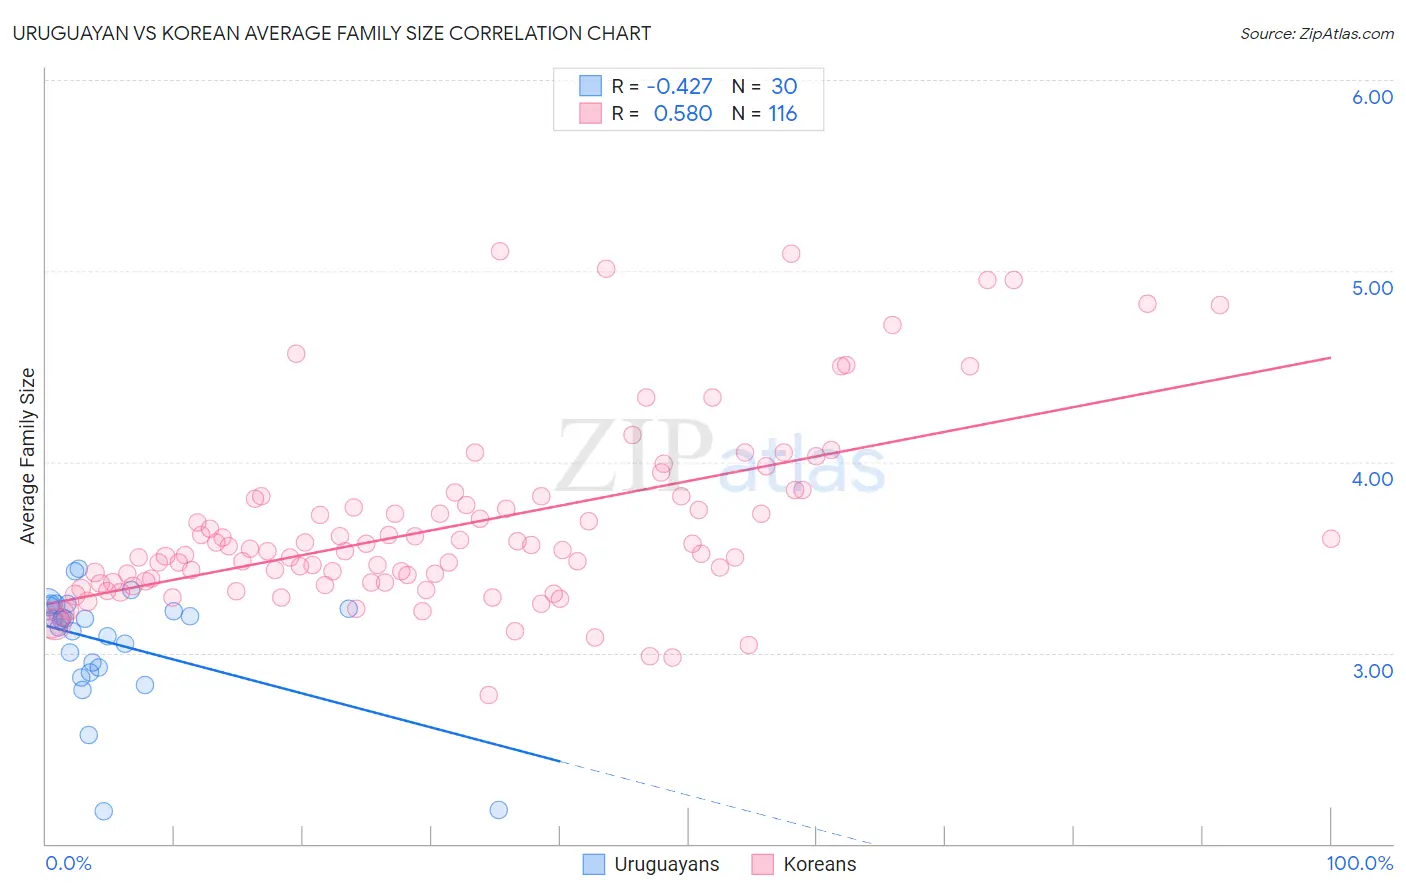
Uruguayan vs Korean Average Family Size Correlation Chart
The statistical analysis conducted on geographies consisting of 144,757,082 people shows a moderate negative correlation between the proportion of Uruguayans and average family size in the United States with a correlation coefficient (R) of -0.427 and weighted average of 3.23. Similarly, the statistical analysis conducted on geographies consisting of 510,405,149 people shows a substantial positive correlation between the proportion of Koreans and average family size in the United States with a correlation coefficient (R) of 0.580 and weighted average of 3.36, a difference of 3.8%.
Average Family Size Correlation Summary
| Measurement | Uruguayan | Korean |
| Minimum | 2.17 | 2.78 |
| Maximum | 3.44 | 5.10 |
| Range | 1.27 | 2.32 |
| Mean | 3.05 | 3.66 |
| Median | 3.17 | 3.54 |
| Interquartile 25% (IQ1) | 2.92 | 3.37 |
| Interquartile 75% (IQ3) | 3.24 | 3.81 |
| Interquartile Range (IQR) | 0.32 | 0.45 |
| Standard Deviation (Sample) | 0.31 | 0.47 |
| Standard Deviation (Population) | 0.30 | 0.47 |
Similar Demographics by Average Family Size
Demographics Similar to Uruguayans by Average Family Size
In terms of average family size, the demographic groups most similar to Uruguayans are Egyptian (3.23, a difference of 0.0%), Ugandan (3.23, a difference of 0.010%), Immigrants from Uganda (3.23, a difference of 0.020%), Immigrants from Senegal (3.23, a difference of 0.030%), and Dutch West Indian (3.23, a difference of 0.040%).
| Demographics | Rating | Rank | Average Family Size |
| Immigrants | Taiwan | 68.1 /100 | #156 | Good 3.24 |
| Immigrants | Uzbekistan | 67.0 /100 | #157 | Good 3.24 |
| Iraqis | 64.3 /100 | #158 | Good 3.24 |
| Ethiopians | 63.9 /100 | #159 | Good 3.24 |
| Immigrants | Iraq | 63.7 /100 | #160 | Good 3.24 |
| Immigrants | Chile | 63.2 /100 | #161 | Good 3.24 |
| Immigrants | Uganda | 60.1 /100 | #162 | Good 3.23 |
| Uruguayans | 58.8 /100 | #163 | Average 3.23 |
| Egyptians | 58.6 /100 | #164 | Average 3.23 |
| Ugandans | 58.4 /100 | #165 | Average 3.23 |
| Immigrants | Senegal | 57.5 /100 | #166 | Average 3.23 |
| Dutch West Indians | 56.9 /100 | #167 | Average 3.23 |
| Taiwanese | 54.2 /100 | #168 | Average 3.23 |
| Aleuts | 54.1 /100 | #169 | Average 3.23 |
| Arabs | 53.8 /100 | #170 | Average 3.23 |
Demographics Similar to Koreans by Average Family Size
In terms of average family size, the demographic groups most similar to Koreans are Immigrants from South Eastern Asia (3.36, a difference of 0.020%), Fijian (3.36, a difference of 0.030%), Immigrants from Honduras (3.36, a difference of 0.060%), Nicaraguan (3.36, a difference of 0.090%), and Immigrants from Dominican Republic (3.35, a difference of 0.12%).
| Demographics | Rating | Rank | Average Family Size |
| Haitians | 100.0 /100 | #46 | Exceptional 3.37 |
| Vietnamese | 100.0 /100 | #47 | Exceptional 3.37 |
| Immigrants | Nicaragua | 100.0 /100 | #48 | Exceptional 3.37 |
| Bangladeshis | 100.0 /100 | #49 | Exceptional 3.37 |
| Immigrants | Bangladesh | 100.0 /100 | #50 | Exceptional 3.36 |
| Nicaraguans | 100.0 /100 | #51 | Exceptional 3.36 |
| Fijians | 100.0 /100 | #52 | Exceptional 3.36 |
| Koreans | 100.0 /100 | #53 | Exceptional 3.36 |
| Immigrants | South Eastern Asia | 100.0 /100 | #54 | Exceptional 3.36 |
| Immigrants | Honduras | 100.0 /100 | #55 | Exceptional 3.36 |
| Immigrants | Dominican Republic | 100.0 /100 | #56 | Exceptional 3.35 |
| Sri Lankans | 100.0 /100 | #57 | Exceptional 3.35 |
| Hondurans | 100.0 /100 | #58 | Exceptional 3.35 |
| Japanese | 100.0 /100 | #59 | Exceptional 3.35 |
| Immigrants | Armenia | 100.0 /100 | #60 | Exceptional 3.35 |