Uruguayan vs Immigrants from South Africa Average Family Size
COMPARE
Uruguayan
Immigrants from South Africa
Average Family Size
Average Family Size Comparison
Uruguayans
Immigrants from South Africa
3.23
AVERAGE FAMILY SIZE
58.8/ 100
METRIC RATING
163rd/ 347
METRIC RANK
3.16
AVERAGE FAMILY SIZE
0.9/ 100
METRIC RATING
265th/ 347
METRIC RANK
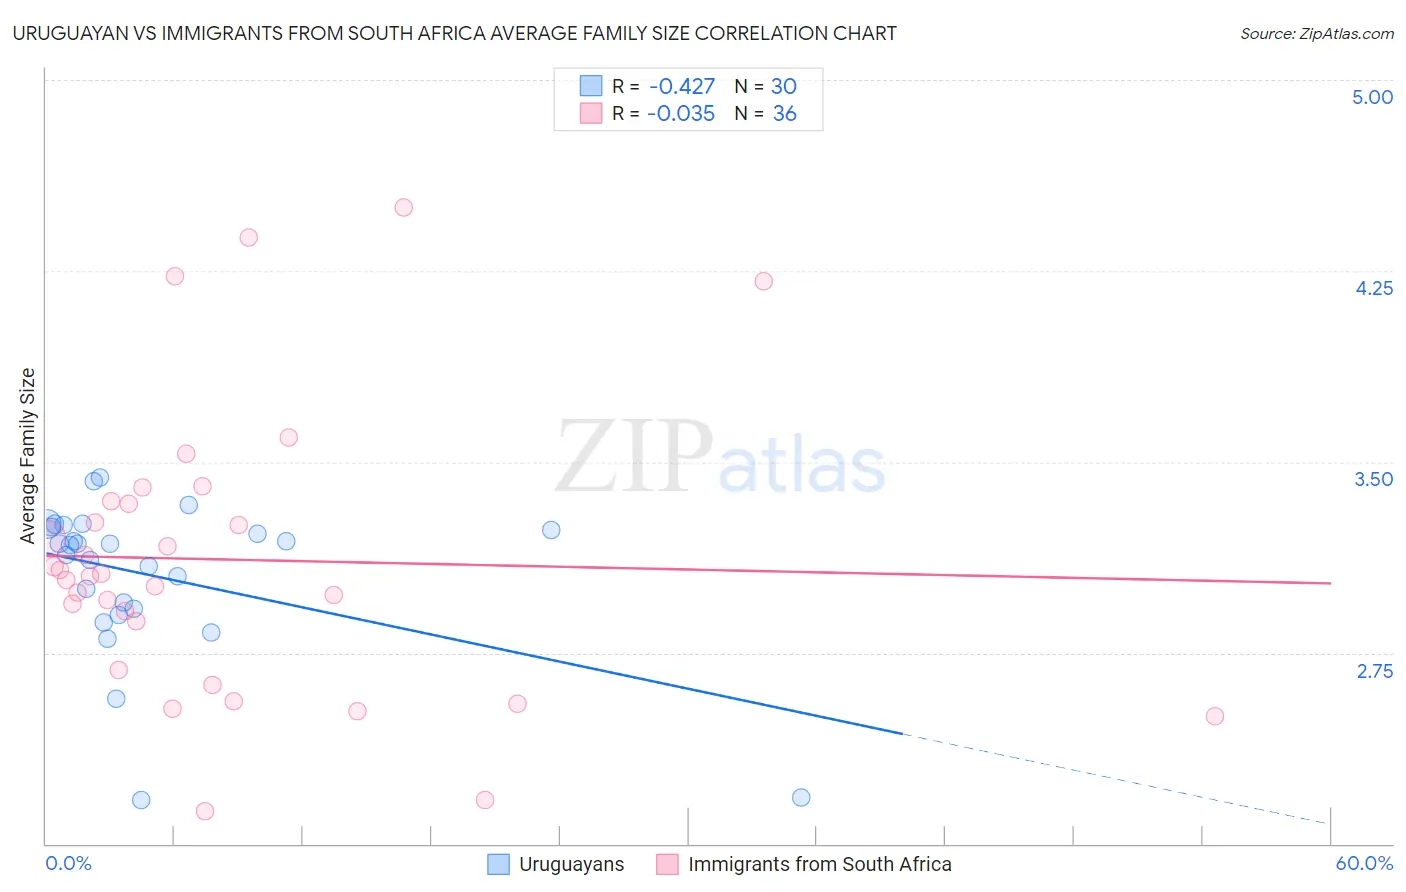
Uruguayan vs Immigrants from South Africa Average Family Size Correlation Chart
The statistical analysis conducted on geographies consisting of 144,757,082 people shows a moderate negative correlation between the proportion of Uruguayans and average family size in the United States with a correlation coefficient (R) of -0.427 and weighted average of 3.23. Similarly, the statistical analysis conducted on geographies consisting of 233,270,414 people shows no correlation between the proportion of Immigrants from South Africa and average family size in the United States with a correlation coefficient (R) of -0.035 and weighted average of 3.16, a difference of 2.4%.
Average Family Size Correlation Summary
| Measurement | Uruguayan | Immigrants from South Africa |
| Minimum | 2.17 | 2.13 |
| Maximum | 3.44 | 4.50 |
| Range | 1.27 | 2.37 |
| Mean | 3.05 | 3.12 |
| Median | 3.17 | 3.06 |
| Interquartile 25% (IQ1) | 2.92 | 2.78 |
| Interquartile 75% (IQ3) | 3.24 | 3.34 |
| Interquartile Range (IQR) | 0.32 | 0.56 |
| Standard Deviation (Sample) | 0.31 | 0.56 |
| Standard Deviation (Population) | 0.30 | 0.55 |
Similar Demographics by Average Family Size
Demographics Similar to Uruguayans by Average Family Size
In terms of average family size, the demographic groups most similar to Uruguayans are Egyptian (3.23, a difference of 0.0%), Ugandan (3.23, a difference of 0.010%), Immigrants from Uganda (3.23, a difference of 0.020%), Immigrants from Senegal (3.23, a difference of 0.030%), and Dutch West Indian (3.23, a difference of 0.040%).
| Demographics | Rating | Rank | Average Family Size |
| Immigrants | Taiwan | 68.1 /100 | #156 | Good 3.24 |
| Immigrants | Uzbekistan | 67.0 /100 | #157 | Good 3.24 |
| Iraqis | 64.3 /100 | #158 | Good 3.24 |
| Ethiopians | 63.9 /100 | #159 | Good 3.24 |
| Immigrants | Iraq | 63.7 /100 | #160 | Good 3.24 |
| Immigrants | Chile | 63.2 /100 | #161 | Good 3.24 |
| Immigrants | Uganda | 60.1 /100 | #162 | Good 3.23 |
| Uruguayans | 58.8 /100 | #163 | Average 3.23 |
| Egyptians | 58.6 /100 | #164 | Average 3.23 |
| Ugandans | 58.4 /100 | #165 | Average 3.23 |
| Immigrants | Senegal | 57.5 /100 | #166 | Average 3.23 |
| Dutch West Indians | 56.9 /100 | #167 | Average 3.23 |
| Taiwanese | 54.2 /100 | #168 | Average 3.23 |
| Aleuts | 54.1 /100 | #169 | Average 3.23 |
| Arabs | 53.8 /100 | #170 | Average 3.23 |
Demographics Similar to Immigrants from South Africa by Average Family Size
In terms of average family size, the demographic groups most similar to Immigrants from South Africa are Immigrants from Greece (3.16, a difference of 0.010%), Iroquois (3.16, a difference of 0.030%), American (3.16, a difference of 0.050%), Immigrants from Bulgaria (3.16, a difference of 0.070%), and Maltese (3.16, a difference of 0.080%).
| Demographics | Rating | Rank | Average Family Size |
| Turks | 1.3 /100 | #258 | Tragic 3.16 |
| Potawatomi | 1.3 /100 | #259 | Tragic 3.16 |
| Immigrants | Albania | 1.3 /100 | #260 | Tragic 3.16 |
| Immigrants | North Macedonia | 1.3 /100 | #261 | Tragic 3.16 |
| Immigrants | Russia | 1.3 /100 | #262 | Tragic 3.16 |
| Immigrants | Bulgaria | 1.0 /100 | #263 | Tragic 3.16 |
| Americans | 1.0 /100 | #264 | Tragic 3.16 |
| Immigrants | South Africa | 0.9 /100 | #265 | Tragic 3.16 |
| Immigrants | Greece | 0.9 /100 | #266 | Tragic 3.16 |
| Iroquois | 0.8 /100 | #267 | Tragic 3.16 |
| Maltese | 0.8 /100 | #268 | Tragic 3.16 |
| Immigrants | Singapore | 0.7 /100 | #269 | Tragic 3.16 |
| Tlingit-Haida | 0.7 /100 | #270 | Tragic 3.16 |
| Immigrants | Germany | 0.7 /100 | #271 | Tragic 3.15 |
| Immigrants | Lithuania | 0.6 /100 | #272 | Tragic 3.15 |