Uruguayan vs Immigrants Single Male Poverty
COMPARE
Uruguayan
Immigrants
Single Male Poverty
Single Male Poverty Comparison
Uruguayans
Immigrants
11.9%
SINGLE MALE POVERTY
99.4/ 100
METRIC RATING
75th/ 347
METRIC RANK
12.7%
SINGLE MALE POVERTY
70.1/ 100
METRIC RATING
153rd/ 347
METRIC RANK
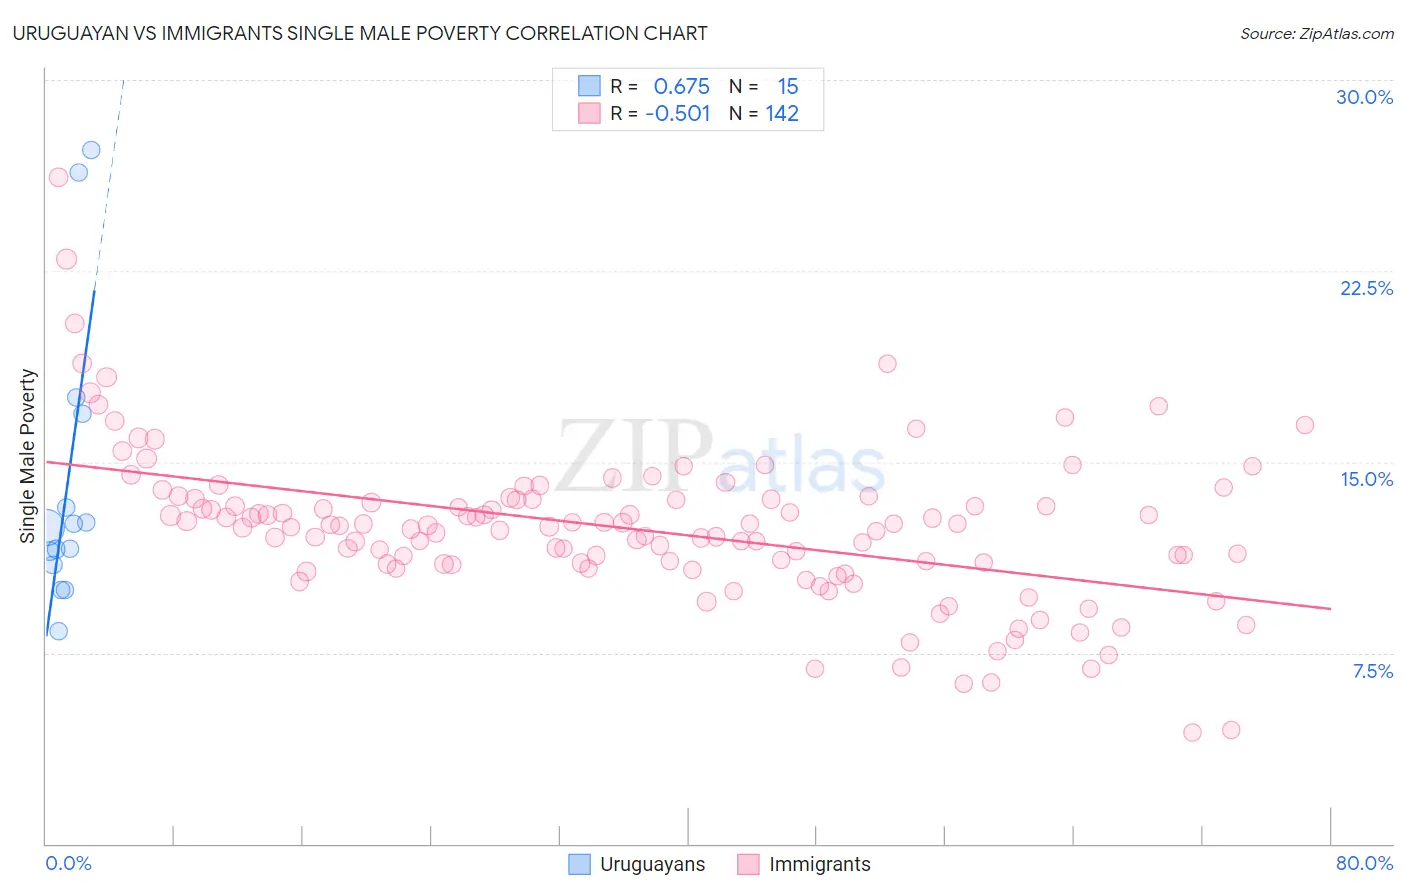
Uruguayan vs Immigrants Single Male Poverty Correlation Chart
The statistical analysis conducted on geographies consisting of 136,478,006 people shows a significant positive correlation between the proportion of Uruguayans and poverty level among single males in the United States with a correlation coefficient (R) of 0.675 and weighted average of 11.9%. Similarly, the statistical analysis conducted on geographies consisting of 470,345,123 people shows a substantial negative correlation between the proportion of Immigrants and poverty level among single males in the United States with a correlation coefficient (R) of -0.501 and weighted average of 12.7%, a difference of 6.0%.
Single Male Poverty Correlation Summary
| Measurement | Uruguayan | Immigrants |
| Minimum | 8.4% | 4.4% |
| Maximum | 27.3% | 26.2% |
| Range | 18.9% | 21.8% |
| Mean | 14.2% | 12.4% |
| Median | 12.4% | 12.5% |
| Interquartile 25% (IQ1) | 11.0% | 11.0% |
| Interquartile 75% (IQ3) | 16.9% | 13.5% |
| Interquartile Range (IQR) | 5.9% | 2.5% |
| Standard Deviation (Sample) | 5.7% | 3.1% |
| Standard Deviation (Population) | 5.5% | 3.1% |
Similar Demographics by Single Male Poverty
Demographics Similar to Uruguayans by Single Male Poverty
In terms of single male poverty, the demographic groups most similar to Uruguayans are Immigrants from Northern Africa (11.9%, a difference of 0.020%), Chilean (11.9%, a difference of 0.19%), Argentinean (11.9%, a difference of 0.25%), Immigrants from Malaysia (12.0%, a difference of 0.29%), and Immigrants from Argentina (11.9%, a difference of 0.37%).
| Demographics | Rating | Rank | Single Male Poverty |
| Immigrants | Croatia | 99.6 /100 | #68 | Exceptional 11.9% |
| Immigrants | Russia | 99.6 /100 | #69 | Exceptional 11.9% |
| Immigrants | Nepal | 99.6 /100 | #70 | Exceptional 11.9% |
| Immigrants | Greece | 99.6 /100 | #71 | Exceptional 11.9% |
| Immigrants | Argentina | 99.5 /100 | #72 | Exceptional 11.9% |
| Argentineans | 99.5 /100 | #73 | Exceptional 11.9% |
| Chileans | 99.5 /100 | #74 | Exceptional 11.9% |
| Uruguayans | 99.4 /100 | #75 | Exceptional 11.9% |
| Immigrants | Northern Africa | 99.4 /100 | #76 | Exceptional 11.9% |
| Immigrants | Malaysia | 99.2 /100 | #77 | Exceptional 12.0% |
| Immigrants | Venezuela | 99.1 /100 | #78 | Exceptional 12.0% |
| Immigrants | Belgium | 99.0 /100 | #79 | Exceptional 12.0% |
| Armenians | 98.7 /100 | #80 | Exceptional 12.1% |
| Immigrants | South America | 98.7 /100 | #81 | Exceptional 12.1% |
| Immigrants | Colombia | 98.6 /100 | #82 | Exceptional 12.1% |
Demographics Similar to Immigrants by Single Male Poverty
In terms of single male poverty, the demographic groups most similar to Immigrants are Immigrants from Scotland (12.7%, a difference of 0.070%), Australian (12.6%, a difference of 0.080%), Immigrants from Spain (12.7%, a difference of 0.090%), Immigrants from Hungary (12.6%, a difference of 0.12%), and Immigrants from Panama (12.6%, a difference of 0.13%).
| Demographics | Rating | Rank | Single Male Poverty |
| Native Hawaiians | 75.0 /100 | #146 | Good 12.6% |
| Malaysians | 74.8 /100 | #147 | Good 12.6% |
| Yugoslavians | 73.9 /100 | #148 | Good 12.6% |
| Sierra Leoneans | 73.0 /100 | #149 | Good 12.6% |
| Immigrants | Panama | 72.1 /100 | #150 | Good 12.6% |
| Immigrants | Hungary | 71.9 /100 | #151 | Good 12.6% |
| Australians | 71.4 /100 | #152 | Good 12.6% |
| Immigrants | Immigrants | 70.1 /100 | #153 | Good 12.7% |
| Immigrants | Scotland | 68.9 /100 | #154 | Good 12.7% |
| Immigrants | Spain | 68.7 /100 | #155 | Good 12.7% |
| Vietnamese | 67.9 /100 | #156 | Good 12.7% |
| Latvians | 67.9 /100 | #157 | Good 12.7% |
| Immigrants | Middle Africa | 64.9 /100 | #158 | Good 12.7% |
| Immigrants | Liberia | 64.2 /100 | #159 | Good 12.7% |
| Greeks | 64.1 /100 | #160 | Good 12.7% |