Turkish vs Serbian GED/Equivalency
COMPARE
Turkish
Serbian
GED/Equivalency
GED/Equivalency Comparison
Turks
Serbians
88.5%
GED/EQUIVALENCY
99.8/ 100
METRIC RATING
30th/ 347
METRIC RANK
87.9%
GED/EQUIVALENCY
99.3/ 100
METRIC RATING
59th/ 347
METRIC RANK
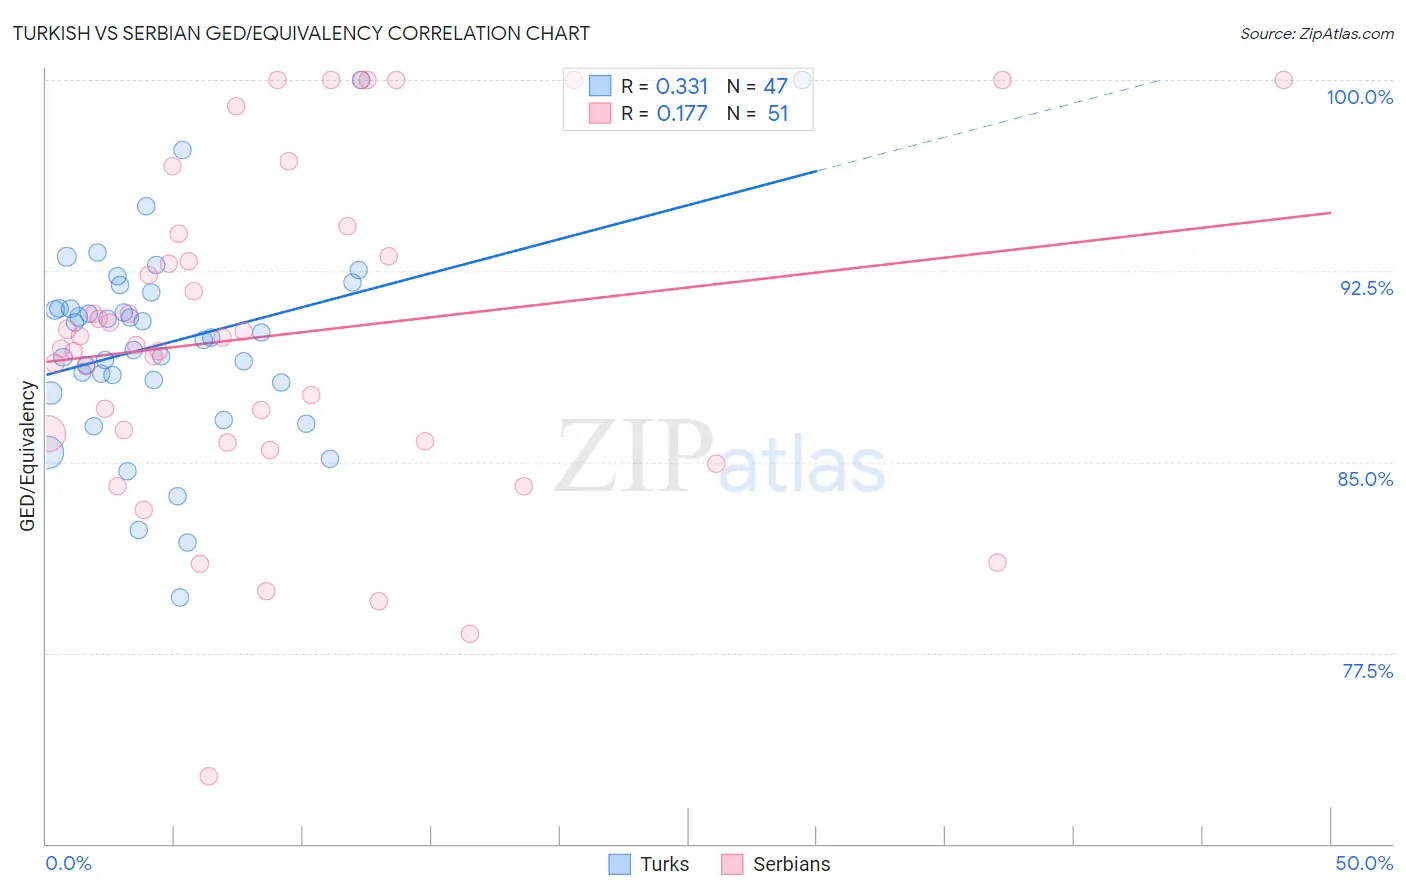
Turkish vs Serbian GED/Equivalency Correlation Chart
The statistical analysis conducted on geographies consisting of 271,864,133 people shows a mild positive correlation between the proportion of Turks and percentage of population with at least ged/equivalency education in the United States with a correlation coefficient (R) of 0.331 and weighted average of 88.5%. Similarly, the statistical analysis conducted on geographies consisting of 267,642,942 people shows a poor positive correlation between the proportion of Serbians and percentage of population with at least ged/equivalency education in the United States with a correlation coefficient (R) of 0.177 and weighted average of 87.9%, a difference of 0.62%.
GED/Equivalency Correlation Summary
| Measurement | Turkish | Serbian |
| Minimum | 79.7% | 72.6% |
| Maximum | 100.0% | 100.0% |
| Range | 20.3% | 27.4% |
| Mean | 89.7% | 90.0% |
| Median | 89.9% | 89.9% |
| Interquartile 25% (IQ1) | 88.1% | 85.8% |
| Interquartile 75% (IQ3) | 91.7% | 94.0% |
| Interquartile Range (IQR) | 3.5% | 8.2% |
| Standard Deviation (Sample) | 4.0% | 6.5% |
| Standard Deviation (Population) | 4.0% | 6.4% |
Similar Demographics by GED/Equivalency
Demographics Similar to Turks by GED/Equivalency
In terms of ged/equivalency, the demographic groups most similar to Turks are Polish (88.5%, a difference of 0.020%), Bhutanese (88.4%, a difference of 0.030%), Immigrants from Northern Europe (88.5%, a difference of 0.050%), Danish (88.4%, a difference of 0.050%), and Immigrants from Lithuania (88.6%, a difference of 0.090%).
| Demographics | Rating | Rank | GED/Equivalency |
| Russians | 99.8 /100 | #23 | Exceptional 88.6% |
| Slovaks | 99.8 /100 | #24 | Exceptional 88.6% |
| Estonians | 99.8 /100 | #25 | Exceptional 88.6% |
| Immigrants | Australia | 99.8 /100 | #26 | Exceptional 88.6% |
| Immigrants | Lithuania | 99.8 /100 | #27 | Exceptional 88.6% |
| Immigrants | Northern Europe | 99.8 /100 | #28 | Exceptional 88.5% |
| Poles | 99.8 /100 | #29 | Exceptional 88.5% |
| Turks | 99.8 /100 | #30 | Exceptional 88.5% |
| Bhutanese | 99.8 /100 | #31 | Exceptional 88.4% |
| Danes | 99.8 /100 | #32 | Exceptional 88.4% |
| Immigrants | Sweden | 99.7 /100 | #33 | Exceptional 88.4% |
| Immigrants | Japan | 99.7 /100 | #34 | Exceptional 88.4% |
| Immigrants | South Central Asia | 99.7 /100 | #35 | Exceptional 88.4% |
| Immigrants | Belgium | 99.7 /100 | #36 | Exceptional 88.3% |
| Immigrants | Austria | 99.7 /100 | #37 | Exceptional 88.3% |
Demographics Similar to Serbians by GED/Equivalency
In terms of ged/equivalency, the demographic groups most similar to Serbians are Immigrants from Czechoslovakia (87.9%, a difference of 0.010%), Northern European (87.9%, a difference of 0.010%), Scandinavian (87.9%, a difference of 0.010%), European (87.9%, a difference of 0.010%), and German (87.9%, a difference of 0.030%).
| Demographics | Rating | Rank | GED/Equivalency |
| Zimbabweans | 99.4 /100 | #52 | Exceptional 88.0% |
| Immigrants | South Africa | 99.4 /100 | #53 | Exceptional 88.0% |
| Soviet Union | 99.4 /100 | #54 | Exceptional 88.0% |
| New Zealanders | 99.4 /100 | #55 | Exceptional 88.0% |
| Immigrants | Denmark | 99.4 /100 | #56 | Exceptional 88.0% |
| Immigrants | Czechoslovakia | 99.3 /100 | #57 | Exceptional 87.9% |
| Northern Europeans | 99.3 /100 | #58 | Exceptional 87.9% |
| Serbians | 99.3 /100 | #59 | Exceptional 87.9% |
| Scandinavians | 99.3 /100 | #60 | Exceptional 87.9% |
| Europeans | 99.3 /100 | #61 | Exceptional 87.9% |
| Germans | 99.3 /100 | #62 | Exceptional 87.9% |
| Immigrants | Turkey | 99.2 /100 | #63 | Exceptional 87.9% |
| Immigrants | Canada | 99.2 /100 | #64 | Exceptional 87.9% |
| Immigrants | North America | 99.1 /100 | #65 | Exceptional 87.8% |
| Immigrants | Bulgaria | 99.1 /100 | #66 | Exceptional 87.8% |