Immigrants from Lithuania vs Serbian Average Family Size
COMPARE
Immigrants from Lithuania
Serbian
Average Family Size
Average Family Size Comparison
Immigrants from Lithuania
Serbians
3.15
AVERAGE FAMILY SIZE
0.6/ 100
METRIC RATING
272nd/ 347
METRIC RANK
3.12
AVERAGE FAMILY SIZE
0.1/ 100
METRIC RATING
316th/ 347
METRIC RANK
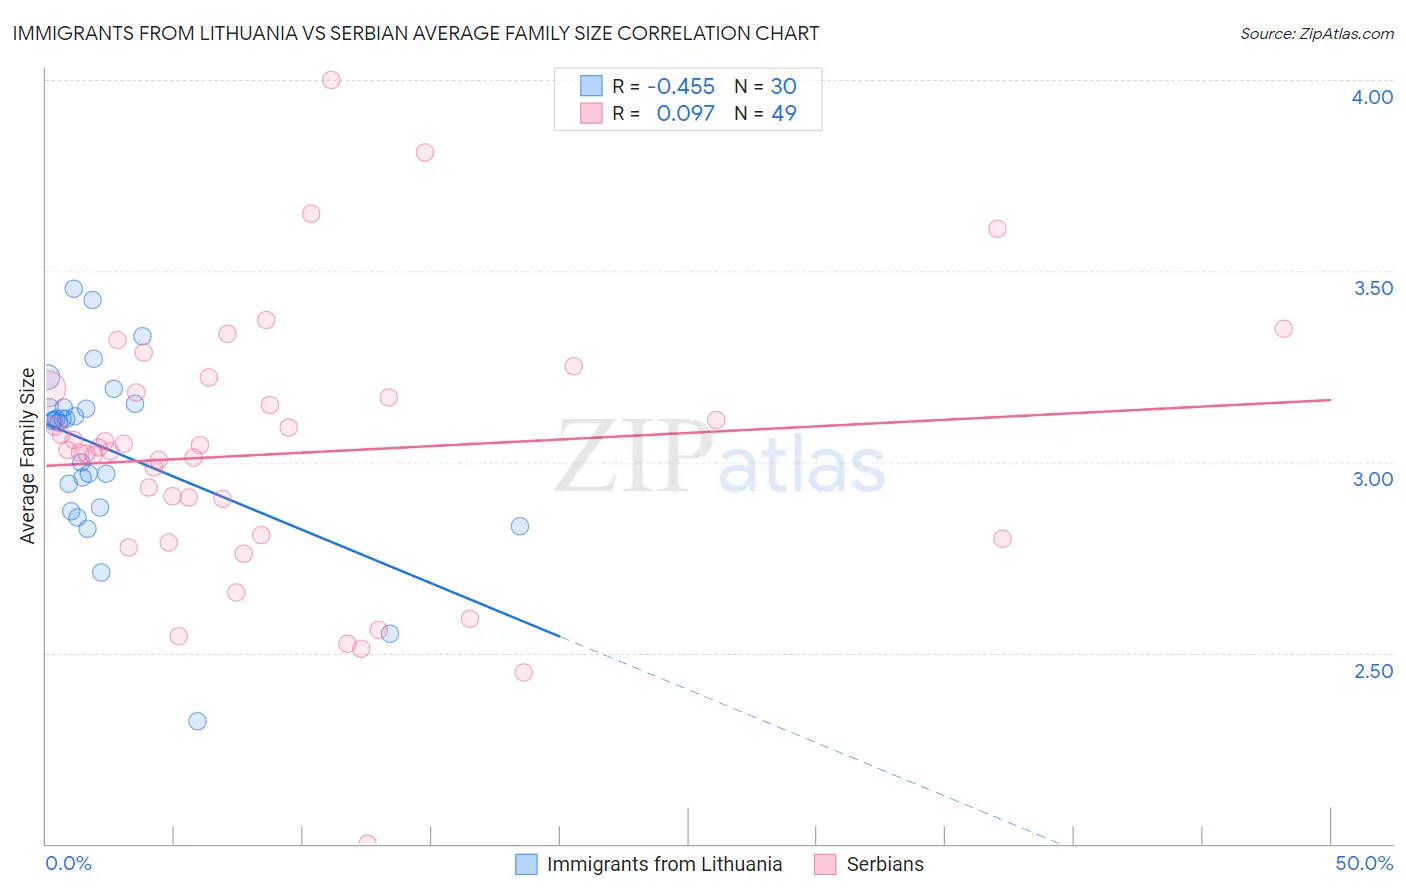
Immigrants from Lithuania vs Serbian Average Family Size Correlation Chart
The statistical analysis conducted on geographies consisting of 117,713,976 people shows a moderate negative correlation between the proportion of Immigrants from Lithuania and average family size in the United States with a correlation coefficient (R) of -0.455 and weighted average of 3.15. Similarly, the statistical analysis conducted on geographies consisting of 267,532,826 people shows a slight positive correlation between the proportion of Serbians and average family size in the United States with a correlation coefficient (R) of 0.097 and weighted average of 3.12, a difference of 1.1%.
Average Family Size Correlation Summary
| Measurement | Immigrants from Lithuania | Serbian |
| Minimum | 2.32 | 2.00 |
| Maximum | 3.45 | 4.00 |
| Range | 1.13 | 2.00 |
| Mean | 3.03 | 3.02 |
| Median | 3.11 | 3.03 |
| Interquartile 25% (IQ1) | 2.88 | 2.81 |
| Interquartile 75% (IQ3) | 3.14 | 3.19 |
| Interquartile Range (IQR) | 0.26 | 0.38 |
| Standard Deviation (Sample) | 0.24 | 0.35 |
| Standard Deviation (Population) | 0.24 | 0.35 |
Similar Demographics by Average Family Size
Demographics Similar to Immigrants from Lithuania by Average Family Size
In terms of average family size, the demographic groups most similar to Immigrants from Lithuania are New Zealander (3.15, a difference of 0.010%), Immigrants from Germany (3.15, a difference of 0.020%), Immigrants from Belgium (3.15, a difference of 0.020%), Cambodian (3.15, a difference of 0.020%), and Tlingit-Haida (3.16, a difference of 0.040%).
| Demographics | Rating | Rank | Average Family Size |
| Immigrants | South Africa | 0.9 /100 | #265 | Tragic 3.16 |
| Immigrants | Greece | 0.9 /100 | #266 | Tragic 3.16 |
| Iroquois | 0.8 /100 | #267 | Tragic 3.16 |
| Maltese | 0.8 /100 | #268 | Tragic 3.16 |
| Immigrants | Singapore | 0.7 /100 | #269 | Tragic 3.16 |
| Tlingit-Haida | 0.7 /100 | #270 | Tragic 3.16 |
| Immigrants | Germany | 0.7 /100 | #271 | Tragic 3.15 |
| Immigrants | Lithuania | 0.6 /100 | #272 | Tragic 3.15 |
| New Zealanders | 0.6 /100 | #273 | Tragic 3.15 |
| Immigrants | Belgium | 0.6 /100 | #274 | Tragic 3.15 |
| Cambodians | 0.6 /100 | #275 | Tragic 3.15 |
| Immigrants | Bosnia and Herzegovina | 0.5 /100 | #276 | Tragic 3.15 |
| Swiss | 0.5 /100 | #277 | Tragic 3.15 |
| Okinawans | 0.5 /100 | #278 | Tragic 3.15 |
| Immigrants | Europe | 0.5 /100 | #279 | Tragic 3.15 |
Demographics Similar to Serbians by Average Family Size
In terms of average family size, the demographic groups most similar to Serbians are Italian (3.12, a difference of 0.060%), Eastern European (3.12, a difference of 0.070%), Welsh (3.12, a difference of 0.070%), Immigrants from Scotland (3.12, a difference of 0.090%), and Russian (3.12, a difference of 0.11%).
| Demographics | Rating | Rank | Average Family Size |
| Northern Europeans | 0.1 /100 | #309 | Tragic 3.13 |
| Czechoslovakians | 0.1 /100 | #310 | Tragic 3.13 |
| Immigrants | Northern Europe | 0.1 /100 | #311 | Tragic 3.13 |
| Immigrants | Australia | 0.1 /100 | #312 | Tragic 3.13 |
| Bulgarians | 0.1 /100 | #313 | Tragic 3.13 |
| Russians | 0.1 /100 | #314 | Tragic 3.12 |
| Immigrants | Scotland | 0.1 /100 | #315 | Tragic 3.12 |
| Serbians | 0.1 /100 | #316 | Tragic 3.12 |
| Italians | 0.1 /100 | #317 | Tragic 3.12 |
| Eastern Europeans | 0.1 /100 | #318 | Tragic 3.12 |
| Welsh | 0.1 /100 | #319 | Tragic 3.12 |
| Immigrants | North America | 0.0 /100 | #320 | Tragic 3.12 |
| Immigrants | Austria | 0.0 /100 | #321 | Tragic 3.12 |
| Immigrants | Canada | 0.0 /100 | #322 | Tragic 3.12 |
| Soviet Union | 0.0 /100 | #323 | Tragic 3.11 |