Bhutanese vs Navajo Single Mother Households
COMPARE
Bhutanese
Navajo
Single Mother Households
Single Mother Households Comparison
Bhutanese
Navajo
5.3%
SINGLE MOTHER HOUSEHOLDS
99.7/ 100
METRIC RATING
27th/ 347
METRIC RANK
8.8%
SINGLE MOTHER HOUSEHOLDS
0.0/ 100
METRIC RATING
337th/ 347
METRIC RANK
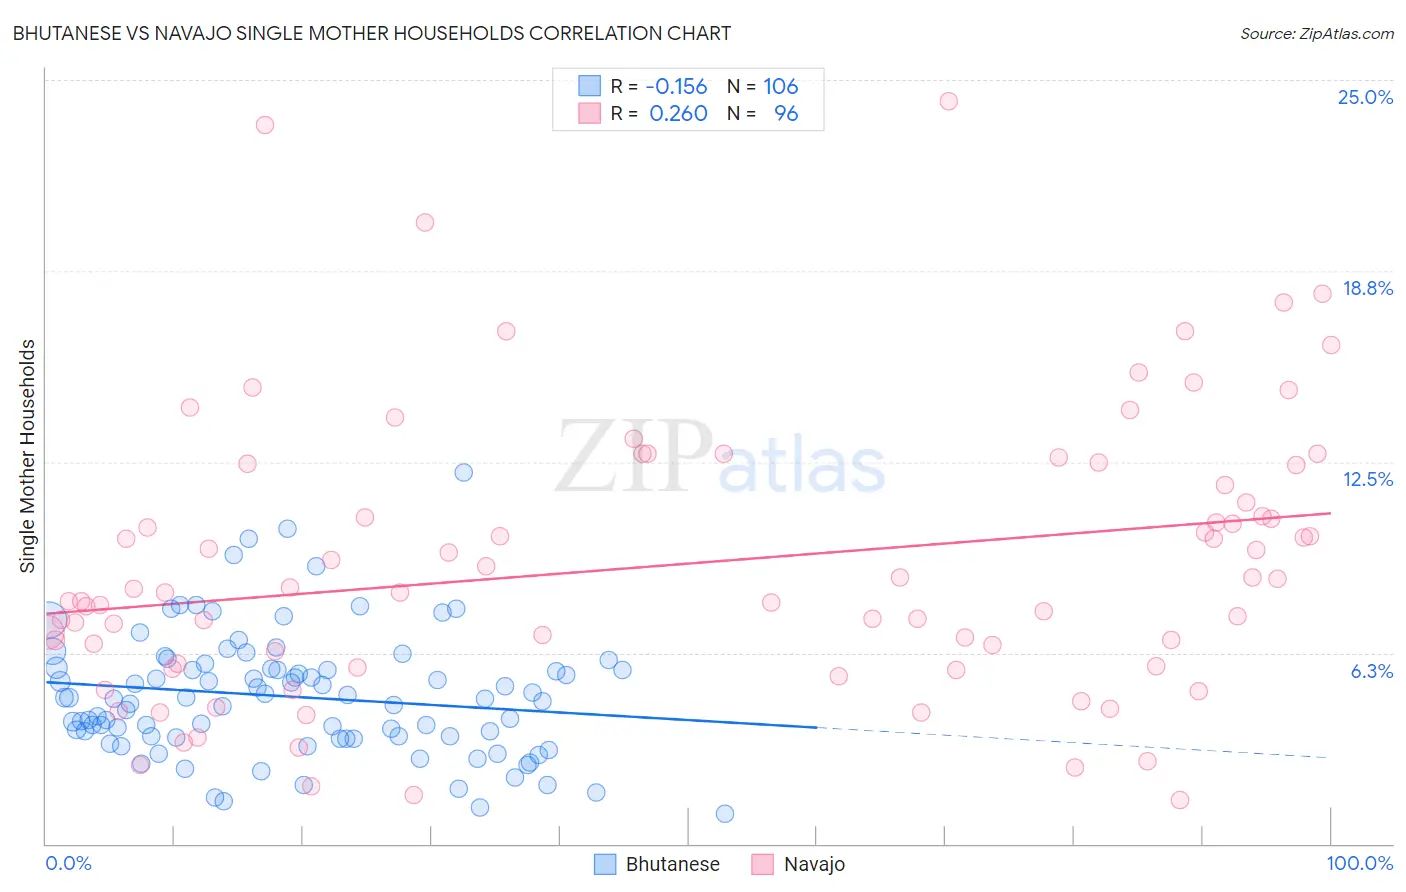
Bhutanese vs Navajo Single Mother Households Correlation Chart
The statistical analysis conducted on geographies consisting of 453,820,628 people shows a poor negative correlation between the proportion of Bhutanese and percentage of single mother households in the United States with a correlation coefficient (R) of -0.156 and weighted average of 5.3%. Similarly, the statistical analysis conducted on geographies consisting of 224,480,128 people shows a weak positive correlation between the proportion of Navajo and percentage of single mother households in the United States with a correlation coefficient (R) of 0.260 and weighted average of 8.8%, a difference of 67.5%.
Single Mother Households Correlation Summary
| Measurement | Bhutanese | Navajo |
| Minimum | 1.0% | 1.4% |
| Maximum | 12.1% | 24.3% |
| Range | 11.1% | 22.9% |
| Mean | 4.8% | 9.1% |
| Median | 4.8% | 8.3% |
| Interquartile 25% (IQ1) | 3.5% | 5.9% |
| Interquartile 75% (IQ3) | 5.7% | 12.1% |
| Interquartile Range (IQR) | 2.3% | 6.2% |
| Standard Deviation (Sample) | 2.0% | 4.6% |
| Standard Deviation (Population) | 2.0% | 4.6% |
Similar Demographics by Single Mother Households
Demographics Similar to Bhutanese by Single Mother Households
In terms of single mother households, the demographic groups most similar to Bhutanese are Russian (5.3%, a difference of 0.10%), Latvian (5.3%, a difference of 0.12%), Burmese (5.3%, a difference of 0.18%), Immigrants from Korea (5.3%, a difference of 0.18%), and Cambodian (5.3%, a difference of 0.19%).
| Demographics | Rating | Rank | Single Mother Households |
| Maltese | 99.9 /100 | #20 | Exceptional 5.2% |
| Eastern Europeans | 99.8 /100 | #21 | Exceptional 5.2% |
| Thais | 99.8 /100 | #22 | Exceptional 5.2% |
| Immigrants | Austria | 99.8 /100 | #23 | Exceptional 5.2% |
| Armenians | 99.8 /100 | #24 | Exceptional 5.2% |
| Immigrants | Japan | 99.8 /100 | #25 | Exceptional 5.2% |
| Immigrants | Lithuania | 99.8 /100 | #26 | Exceptional 5.3% |
| Bhutanese | 99.7 /100 | #27 | Exceptional 5.3% |
| Russians | 99.7 /100 | #28 | Exceptional 5.3% |
| Latvians | 99.7 /100 | #29 | Exceptional 5.3% |
| Burmese | 99.7 /100 | #30 | Exceptional 5.3% |
| Immigrants | Korea | 99.7 /100 | #31 | Exceptional 5.3% |
| Cambodians | 99.7 /100 | #32 | Exceptional 5.3% |
| Immigrants | Switzerland | 99.7 /100 | #33 | Exceptional 5.3% |
| Bulgarians | 99.7 /100 | #34 | Exceptional 5.3% |
Demographics Similar to Navajo by Single Mother Households
In terms of single mother households, the demographic groups most similar to Navajo are Cape Verdean (8.9%, a difference of 0.10%), Puerto Rican (8.7%, a difference of 1.2%), Immigrants from Dominica (8.7%, a difference of 1.2%), Immigrants from Liberia (8.7%, a difference of 1.5%), and Black/African American (9.0%, a difference of 1.7%).
| Demographics | Rating | Rank | Single Mother Households |
| Inupiat | 0.0 /100 | #330 | Tragic 8.5% |
| Sioux | 0.0 /100 | #331 | Tragic 8.5% |
| U.S. Virgin Islanders | 0.0 /100 | #332 | Tragic 8.6% |
| Liberians | 0.0 /100 | #333 | Tragic 8.6% |
| Immigrants | Liberia | 0.0 /100 | #334 | Tragic 8.7% |
| Immigrants | Dominica | 0.0 /100 | #335 | Tragic 8.7% |
| Puerto Ricans | 0.0 /100 | #336 | Tragic 8.7% |
| Navajo | 0.0 /100 | #337 | Tragic 8.8% |
| Cape Verdeans | 0.0 /100 | #338 | Tragic 8.9% |
| Blacks/African Americans | 0.0 /100 | #339 | Tragic 9.0% |
| Lumbee | 0.0 /100 | #340 | Tragic 9.1% |
| Tohono O'odham | 0.0 /100 | #341 | Tragic 9.1% |
| Menominee | 0.0 /100 | #342 | Tragic 9.2% |
| Dominicans | 0.0 /100 | #343 | Tragic 9.2% |
| Immigrants | Dominican Republic | 0.0 /100 | #344 | Tragic 9.5% |