English vs Navajo Single Mother Households
COMPARE
English
Navajo
Single Mother Households
Single Mother Households Comparison
English
Navajo
5.8%
SINGLE MOTHER HOUSEHOLDS
96.2/ 100
METRIC RATING
102nd/ 347
METRIC RANK
8.8%
SINGLE MOTHER HOUSEHOLDS
0.0/ 100
METRIC RATING
337th/ 347
METRIC RANK
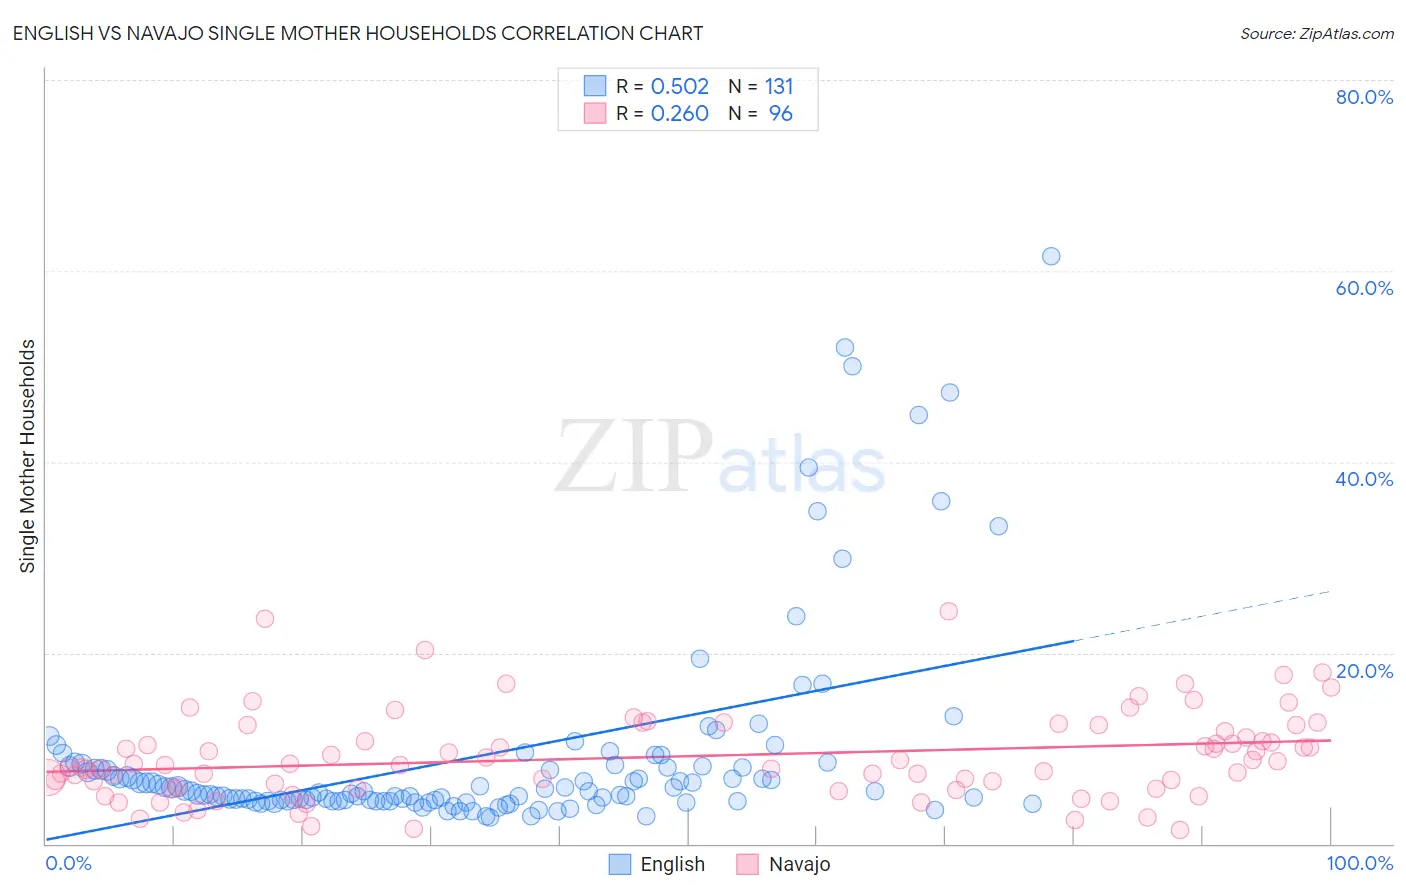
English vs Navajo Single Mother Households Correlation Chart
The statistical analysis conducted on geographies consisting of 572,865,481 people shows a substantial positive correlation between the proportion of English and percentage of single mother households in the United States with a correlation coefficient (R) of 0.502 and weighted average of 5.8%. Similarly, the statistical analysis conducted on geographies consisting of 224,480,128 people shows a weak positive correlation between the proportion of Navajo and percentage of single mother households in the United States with a correlation coefficient (R) of 0.260 and weighted average of 8.8%, a difference of 53.7%.
Single Mother Households Correlation Summary
| Measurement | English | Navajo |
| Minimum | 2.8% | 1.4% |
| Maximum | 61.5% | 24.3% |
| Range | 58.8% | 22.9% |
| Mean | 9.2% | 9.1% |
| Median | 5.5% | 8.3% |
| Interquartile 25% (IQ1) | 4.5% | 5.9% |
| Interquartile 75% (IQ3) | 8.1% | 12.1% |
| Interquartile Range (IQR) | 3.6% | 6.2% |
| Standard Deviation (Sample) | 10.6% | 4.6% |
| Standard Deviation (Population) | 10.5% | 4.6% |
Similar Demographics by Single Mother Households
Demographics Similar to English by Single Mother Households
In terms of single mother households, the demographic groups most similar to English are German (5.8%, a difference of 0.0%), Scottish (5.8%, a difference of 0.020%), Northern European (5.8%, a difference of 0.020%), Scandinavian (5.8%, a difference of 0.030%), and Immigrants from Poland (5.8%, a difference of 0.050%).
| Demographics | Rating | Rank | Single Mother Households |
| Slovaks | 96.6 /100 | #95 | Exceptional 5.7% |
| Austrians | 96.4 /100 | #96 | Exceptional 5.7% |
| Tlingit-Haida | 96.4 /100 | #97 | Exceptional 5.7% |
| Immigrants | South Africa | 96.3 /100 | #98 | Exceptional 5.7% |
| Immigrants | Poland | 96.3 /100 | #99 | Exceptional 5.8% |
| Scandinavians | 96.2 /100 | #100 | Exceptional 5.8% |
| Germans | 96.2 /100 | #101 | Exceptional 5.8% |
| English | 96.2 /100 | #102 | Exceptional 5.8% |
| Scottish | 96.2 /100 | #103 | Exceptional 5.8% |
| Northern Europeans | 96.2 /100 | #104 | Exceptional 5.8% |
| Taiwanese | 96.1 /100 | #105 | Exceptional 5.8% |
| Immigrants | Ukraine | 95.9 /100 | #106 | Exceptional 5.8% |
| Paraguayans | 95.8 /100 | #107 | Exceptional 5.8% |
| Immigrants | Italy | 95.8 /100 | #108 | Exceptional 5.8% |
| Immigrants | Western Europe | 95.7 /100 | #109 | Exceptional 5.8% |
Demographics Similar to Navajo by Single Mother Households
In terms of single mother households, the demographic groups most similar to Navajo are Cape Verdean (8.9%, a difference of 0.10%), Puerto Rican (8.7%, a difference of 1.2%), Immigrants from Dominica (8.7%, a difference of 1.2%), Immigrants from Liberia (8.7%, a difference of 1.5%), and Black/African American (9.0%, a difference of 1.7%).
| Demographics | Rating | Rank | Single Mother Households |
| Inupiat | 0.0 /100 | #330 | Tragic 8.5% |
| Sioux | 0.0 /100 | #331 | Tragic 8.5% |
| U.S. Virgin Islanders | 0.0 /100 | #332 | Tragic 8.6% |
| Liberians | 0.0 /100 | #333 | Tragic 8.6% |
| Immigrants | Liberia | 0.0 /100 | #334 | Tragic 8.7% |
| Immigrants | Dominica | 0.0 /100 | #335 | Tragic 8.7% |
| Puerto Ricans | 0.0 /100 | #336 | Tragic 8.7% |
| Navajo | 0.0 /100 | #337 | Tragic 8.8% |
| Cape Verdeans | 0.0 /100 | #338 | Tragic 8.9% |
| Blacks/African Americans | 0.0 /100 | #339 | Tragic 9.0% |
| Lumbee | 0.0 /100 | #340 | Tragic 9.1% |
| Tohono O'odham | 0.0 /100 | #341 | Tragic 9.1% |
| Menominee | 0.0 /100 | #342 | Tragic 9.2% |
| Dominicans | 0.0 /100 | #343 | Tragic 9.2% |
| Immigrants | Dominican Republic | 0.0 /100 | #344 | Tragic 9.5% |