Shoshone vs Navajo Single Mother Households
COMPARE
Shoshone
Navajo
Single Mother Households
Single Mother Households Comparison
Shoshone
Navajo
6.8%
SINGLE MOTHER HOUSEHOLDS
5.7/ 100
METRIC RATING
215th/ 347
METRIC RANK
8.8%
SINGLE MOTHER HOUSEHOLDS
0.0/ 100
METRIC RATING
337th/ 347
METRIC RANK
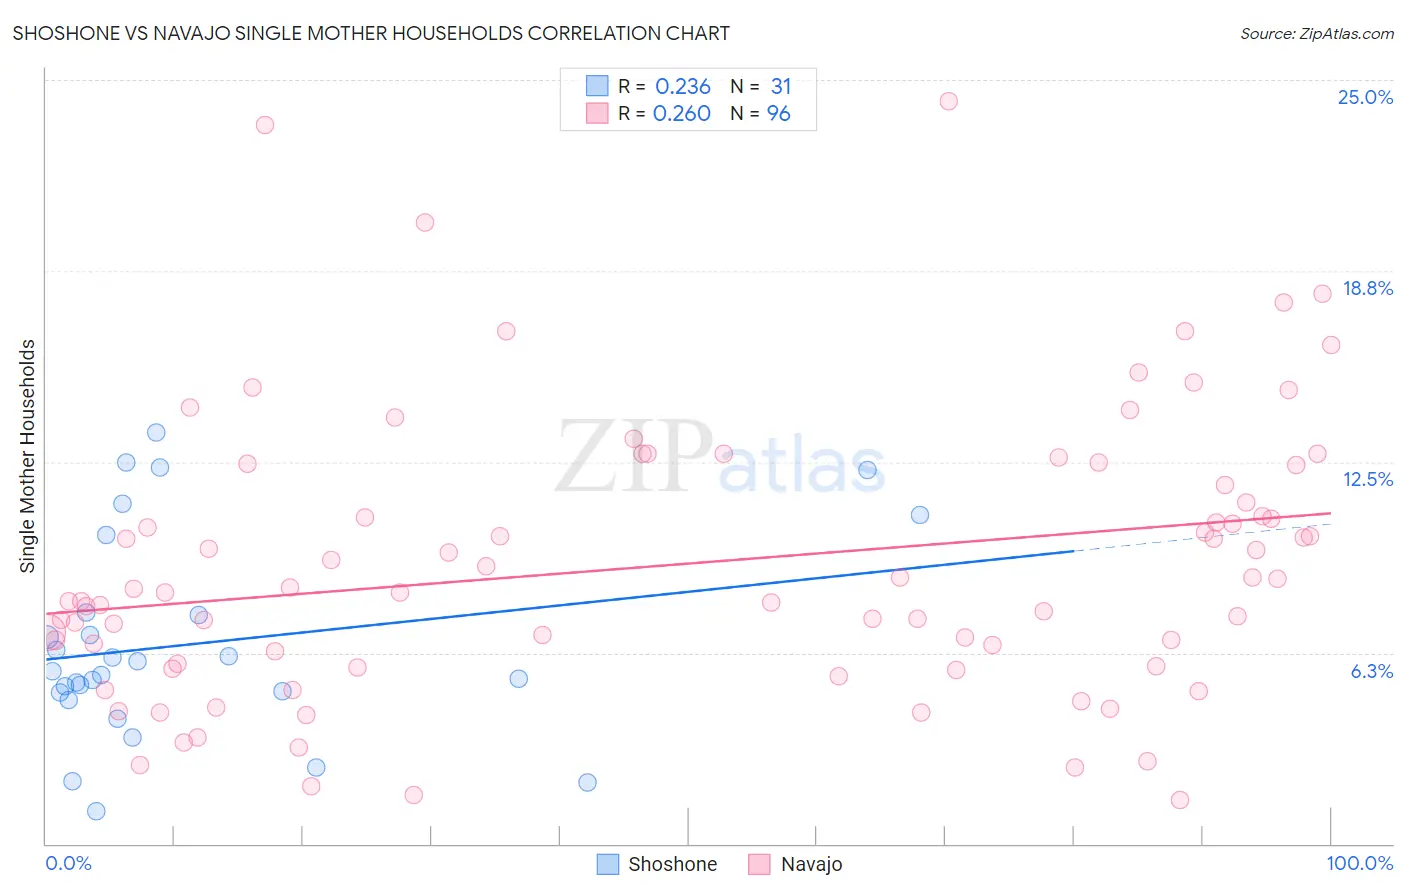
Shoshone vs Navajo Single Mother Households Correlation Chart
The statistical analysis conducted on geographies consisting of 66,546,675 people shows a weak positive correlation between the proportion of Shoshone and percentage of single mother households in the United States with a correlation coefficient (R) of 0.236 and weighted average of 6.8%. Similarly, the statistical analysis conducted on geographies consisting of 224,480,128 people shows a weak positive correlation between the proportion of Navajo and percentage of single mother households in the United States with a correlation coefficient (R) of 0.260 and weighted average of 8.8%, a difference of 30.1%.
Single Mother Households Correlation Summary
| Measurement | Shoshone | Navajo |
| Minimum | 1.1% | 1.4% |
| Maximum | 13.5% | 24.3% |
| Range | 12.4% | 22.9% |
| Mean | 6.6% | 9.1% |
| Median | 5.6% | 8.3% |
| Interquartile 25% (IQ1) | 5.0% | 5.9% |
| Interquartile 75% (IQ3) | 7.6% | 12.1% |
| Interquartile Range (IQR) | 2.6% | 6.2% |
| Standard Deviation (Sample) | 3.3% | 4.6% |
| Standard Deviation (Population) | 3.2% | 4.6% |
Similar Demographics by Single Mother Households
Demographics Similar to Shoshone by Single Mother Households
In terms of single mother households, the demographic groups most similar to Shoshone are Cherokee (6.8%, a difference of 0.29%), Aleut (6.8%, a difference of 0.44%), Immigrants from Eastern Africa (6.8%, a difference of 0.65%), Immigrants (6.8%, a difference of 0.74%), and Immigrants from Uruguay (6.7%, a difference of 0.91%).
| Demographics | Rating | Rank | Single Mother Households |
| Vietnamese | 11.3 /100 | #208 | Poor 6.7% |
| Immigrants | Colombia | 10.5 /100 | #209 | Poor 6.7% |
| Immigrants | Nonimmigrants | 10.4 /100 | #210 | Poor 6.7% |
| Immigrants | Venezuela | 8.5 /100 | #211 | Tragic 6.7% |
| Immigrants | Eritrea | 8.4 /100 | #212 | Tragic 6.7% |
| Immigrants | Costa Rica | 8.2 /100 | #213 | Tragic 6.7% |
| Immigrants | Uruguay | 7.9 /100 | #214 | Tragic 6.7% |
| Shoshone | 5.7 /100 | #215 | Tragic 6.8% |
| Cherokee | 5.1 /100 | #216 | Tragic 6.8% |
| Aleuts | 4.8 /100 | #217 | Tragic 6.8% |
| Immigrants | Eastern Africa | 4.4 /100 | #218 | Tragic 6.8% |
| Immigrants | Immigrants | 4.3 /100 | #219 | Tragic 6.8% |
| Immigrants | Thailand | 4.0 /100 | #220 | Tragic 6.9% |
| French American Indians | 3.7 /100 | #221 | Tragic 6.9% |
| Immigrants | Bangladesh | 3.7 /100 | #222 | Tragic 6.9% |
Demographics Similar to Navajo by Single Mother Households
In terms of single mother households, the demographic groups most similar to Navajo are Cape Verdean (8.9%, a difference of 0.10%), Puerto Rican (8.7%, a difference of 1.2%), Immigrants from Dominica (8.7%, a difference of 1.2%), Immigrants from Liberia (8.7%, a difference of 1.5%), and Black/African American (9.0%, a difference of 1.7%).
| Demographics | Rating | Rank | Single Mother Households |
| Inupiat | 0.0 /100 | #330 | Tragic 8.5% |
| Sioux | 0.0 /100 | #331 | Tragic 8.5% |
| U.S. Virgin Islanders | 0.0 /100 | #332 | Tragic 8.6% |
| Liberians | 0.0 /100 | #333 | Tragic 8.6% |
| Immigrants | Liberia | 0.0 /100 | #334 | Tragic 8.7% |
| Immigrants | Dominica | 0.0 /100 | #335 | Tragic 8.7% |
| Puerto Ricans | 0.0 /100 | #336 | Tragic 8.7% |
| Navajo | 0.0 /100 | #337 | Tragic 8.8% |
| Cape Verdeans | 0.0 /100 | #338 | Tragic 8.9% |
| Blacks/African Americans | 0.0 /100 | #339 | Tragic 9.0% |
| Lumbee | 0.0 /100 | #340 | Tragic 9.1% |
| Tohono O'odham | 0.0 /100 | #341 | Tragic 9.1% |
| Menominee | 0.0 /100 | #342 | Tragic 9.2% |
| Dominicans | 0.0 /100 | #343 | Tragic 9.2% |
| Immigrants | Dominican Republic | 0.0 /100 | #344 | Tragic 9.5% |