Tlingit-Haida vs Immigrants from Iran High School Diploma
COMPARE
Tlingit-Haida
Immigrants from Iran
High School Diploma
High School Diploma Comparison
Tlingit-Haida
Immigrants from Iran
91.4%
HIGH SCHOOL DIPLOMA
99.9/ 100
METRIC RATING
28th/ 347
METRIC RANK
90.9%
HIGH SCHOOL DIPLOMA
99.5/ 100
METRIC RATING
67th/ 347
METRIC RANK
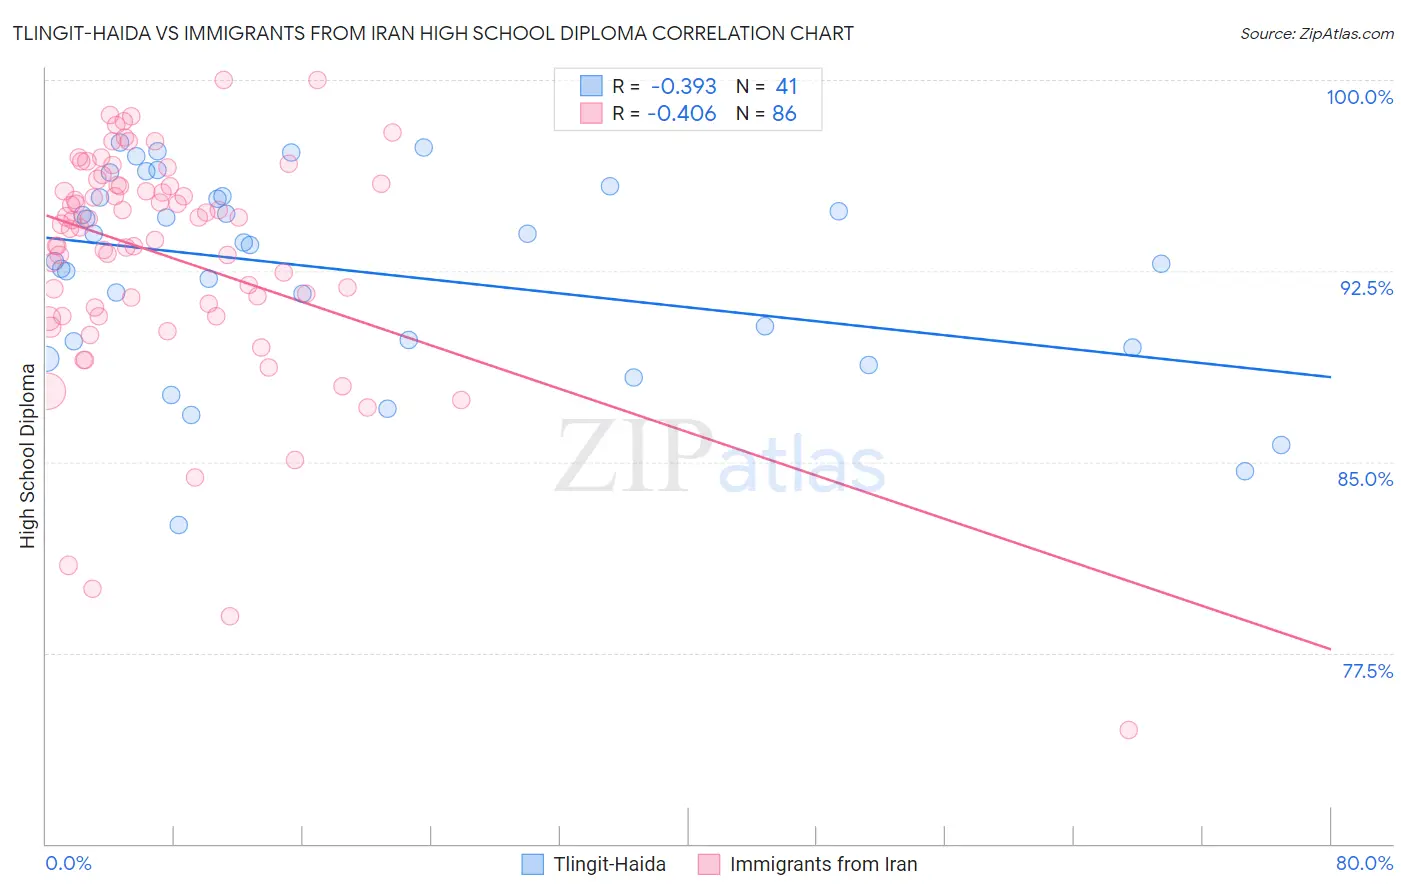
Tlingit-Haida vs Immigrants from Iran High School Diploma Correlation Chart
The statistical analysis conducted on geographies consisting of 60,871,919 people shows a mild negative correlation between the proportion of Tlingit-Haida and percentage of population with at least high school diploma education in the United States with a correlation coefficient (R) of -0.393 and weighted average of 91.4%. Similarly, the statistical analysis conducted on geographies consisting of 279,904,902 people shows a moderate negative correlation between the proportion of Immigrants from Iran and percentage of population with at least high school diploma education in the United States with a correlation coefficient (R) of -0.406 and weighted average of 90.9%, a difference of 0.56%.
High School Diploma Correlation Summary
| Measurement | Tlingit-Haida | Immigrants from Iran |
| Minimum | 82.5% | 74.5% |
| Maximum | 97.5% | 100.0% |
| Range | 15.0% | 25.5% |
| Mean | 92.5% | 93.1% |
| Median | 93.5% | 94.4% |
| Interquartile 25% (IQ1) | 89.6% | 91.1% |
| Interquartile 75% (IQ3) | 95.4% | 95.9% |
| Interquartile Range (IQR) | 5.8% | 4.8% |
| Standard Deviation (Sample) | 3.9% | 4.6% |
| Standard Deviation (Population) | 3.8% | 4.6% |
Similar Demographics by High School Diploma
Demographics Similar to Tlingit-Haida by High School Diploma
In terms of high school diploma, the demographic groups most similar to Tlingit-Haida are European (91.4%, a difference of 0.020%), Cypriot (91.5%, a difference of 0.030%), Iranian (91.4%, a difference of 0.030%), Immigrants from Northern Europe (91.4%, a difference of 0.030%), and English (91.4%, a difference of 0.040%).
| Demographics | Rating | Rank | High School Diploma |
| Filipinos | 99.9 /100 | #21 | Exceptional 91.6% |
| Estonians | 99.9 /100 | #22 | Exceptional 91.6% |
| Scandinavians | 99.9 /100 | #23 | Exceptional 91.5% |
| Italians | 99.9 /100 | #24 | Exceptional 91.5% |
| Thais | 99.9 /100 | #25 | Exceptional 91.5% |
| Russians | 99.9 /100 | #26 | Exceptional 91.5% |
| Cypriots | 99.9 /100 | #27 | Exceptional 91.5% |
| Tlingit-Haida | 99.9 /100 | #28 | Exceptional 91.4% |
| Europeans | 99.9 /100 | #29 | Exceptional 91.4% |
| Iranians | 99.9 /100 | #30 | Exceptional 91.4% |
| Immigrants | Northern Europe | 99.9 /100 | #31 | Exceptional 91.4% |
| English | 99.9 /100 | #32 | Exceptional 91.4% |
| Okinawans | 99.9 /100 | #33 | Exceptional 91.4% |
| Scottish | 99.9 /100 | #34 | Exceptional 91.4% |
| Irish | 99.9 /100 | #35 | Exceptional 91.4% |
Demographics Similar to Immigrants from Iran by High School Diploma
In terms of high school diploma, the demographic groups most similar to Immigrants from Iran are Czechoslovakian (90.9%, a difference of 0.010%), French (91.0%, a difference of 0.020%), Ukrainian (91.0%, a difference of 0.030%), Immigrants from South Africa (91.0%, a difference of 0.030%), and Immigrants from Netherlands (91.0%, a difference of 0.040%).
| Demographics | Rating | Rank | High School Diploma |
| Immigrants | Japan | 99.6 /100 | #60 | Exceptional 91.0% |
| Immigrants | Taiwan | 99.6 /100 | #61 | Exceptional 91.0% |
| Austrians | 99.6 /100 | #62 | Exceptional 91.0% |
| Immigrants | Netherlands | 99.6 /100 | #63 | Exceptional 91.0% |
| Ukrainians | 99.6 /100 | #64 | Exceptional 91.0% |
| Immigrants | South Africa | 99.6 /100 | #65 | Exceptional 91.0% |
| French | 99.5 /100 | #66 | Exceptional 91.0% |
| Immigrants | Iran | 99.5 /100 | #67 | Exceptional 90.9% |
| Czechoslovakians | 99.5 /100 | #68 | Exceptional 90.9% |
| French Canadians | 99.5 /100 | #69 | Exceptional 90.9% |
| Immigrants | Latvia | 99.5 /100 | #70 | Exceptional 90.9% |
| Alaskan Athabascans | 99.4 /100 | #71 | Exceptional 90.9% |
| Soviet Union | 99.4 /100 | #72 | Exceptional 90.9% |
| Immigrants | South Central Asia | 99.4 /100 | #73 | Exceptional 90.9% |
| Immigrants | Czechoslovakia | 99.4 /100 | #74 | Exceptional 90.9% |