Tlingit-Haida vs Immigrants from St. Vincent and the Grenadines Family Households with Children
COMPARE
Tlingit-Haida
Immigrants from St. Vincent and the Grenadines
Family Households with Children
Family Households with Children Comparison
Tlingit-Haida
Immigrants from St. Vincent and the Grenadines
26.0%
FAMILY HOUSEHOLDS WITH CHILDREN
0.0/ 100
METRIC RATING
320th/ 347
METRIC RANK
25.6%
FAMILY HOUSEHOLDS WITH CHILDREN
0.0/ 100
METRIC RATING
339th/ 347
METRIC RANK
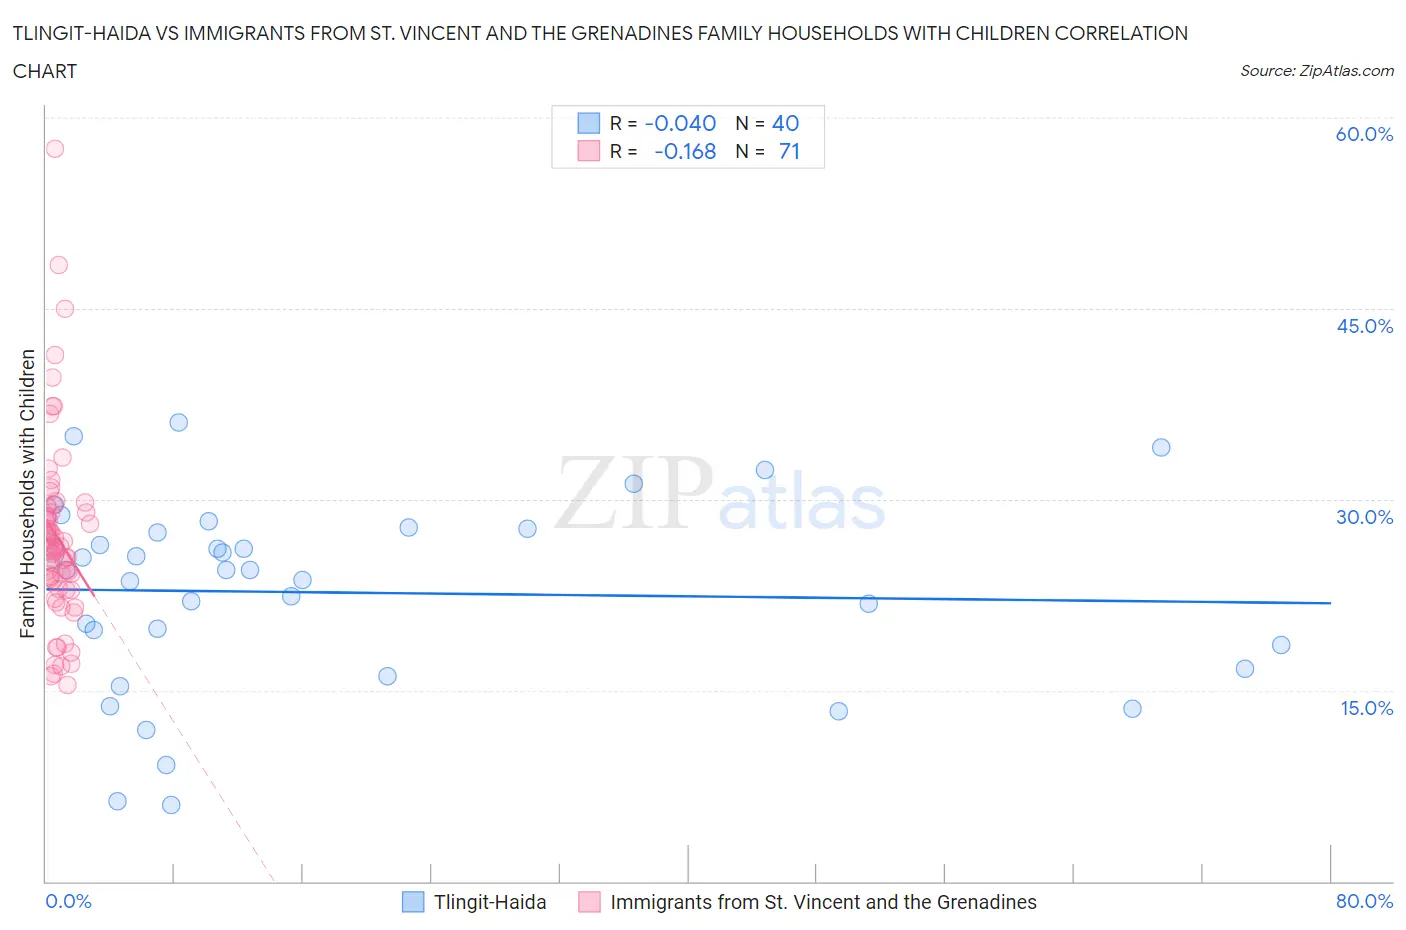
Tlingit-Haida vs Immigrants from St. Vincent and the Grenadines Family Households with Children Correlation Chart
The statistical analysis conducted on geographies consisting of 60,854,309 people shows no correlation between the proportion of Tlingit-Haida and percentage of family households with children in the United States with a correlation coefficient (R) of -0.040 and weighted average of 26.0%. Similarly, the statistical analysis conducted on geographies consisting of 56,180,782 people shows a poor negative correlation between the proportion of Immigrants from St. Vincent and the Grenadines and percentage of family households with children in the United States with a correlation coefficient (R) of -0.168 and weighted average of 25.6%, a difference of 1.8%.
Family Households with Children Correlation Summary
| Measurement | Tlingit-Haida | Immigrants from St. Vincent and the Grenadines |
| Minimum | 6.0% | 15.4% |
| Maximum | 36.0% | 57.6% |
| Range | 30.0% | 42.2% |
| Mean | 22.7% | 27.0% |
| Median | 24.4% | 26.1% |
| Interquartile 25% (IQ1) | 17.6% | 23.0% |
| Interquartile 75% (IQ3) | 27.6% | 29.0% |
| Interquartile Range (IQR) | 10.0% | 6.0% |
| Standard Deviation (Sample) | 7.5% | 7.4% |
| Standard Deviation (Population) | 7.4% | 7.3% |
Demographics Similar to Tlingit-Haida and Immigrants from St. Vincent and the Grenadines by Family Households with Children
In terms of family households with children, the demographic groups most similar to Tlingit-Haida are British West Indian (26.0%, a difference of 0.010%), Immigrants from France (26.0%, a difference of 0.020%), Immigrants from Greece (26.0%, a difference of 0.030%), Immigrants from Australia (26.0%, a difference of 0.060%), and Chinese (26.0%, a difference of 0.090%). Similarly, the demographic groups most similar to Immigrants from St. Vincent and the Grenadines are Arapaho (25.6%, a difference of 0.010%), Puerto Rican (25.6%, a difference of 0.040%), Immigrants from West Indies (25.7%, a difference of 0.43%), Immigrants from Croatia (25.7%, a difference of 0.52%), and Slovak (25.7%, a difference of 0.54%).
| Demographics | Rating | Rank | Family Households with Children |
| Immigrants | France | 0.0 /100 | #319 | Tragic 26.0% |
| Tlingit-Haida | 0.0 /100 | #320 | Tragic 26.0% |
| British West Indians | 0.0 /100 | #321 | Tragic 26.0% |
| Immigrants | Greece | 0.0 /100 | #322 | Tragic 26.0% |
| Immigrants | Australia | 0.0 /100 | #323 | Tragic 26.0% |
| Chinese | 0.0 /100 | #324 | Tragic 26.0% |
| Barbadians | 0.0 /100 | #325 | Tragic 26.0% |
| Immigrants | Ireland | 0.0 /100 | #326 | Tragic 26.0% |
| Immigrants | Barbados | 0.0 /100 | #327 | Tragic 26.0% |
| Immigrants | Albania | 0.0 /100 | #328 | Tragic 25.9% |
| Cypriots | 0.0 /100 | #329 | Tragic 25.9% |
| Immigrants | Latvia | 0.0 /100 | #330 | Tragic 25.9% |
| Slovenes | 0.0 /100 | #331 | Tragic 25.8% |
| Immigrants | Austria | 0.0 /100 | #332 | Tragic 25.8% |
| Immigrants | Switzerland | 0.0 /100 | #333 | Tragic 25.7% |
| Slovaks | 0.0 /100 | #334 | Tragic 25.7% |
| Immigrants | Croatia | 0.0 /100 | #335 | Tragic 25.7% |
| Immigrants | West Indies | 0.0 /100 | #336 | Tragic 25.7% |
| Puerto Ricans | 0.0 /100 | #337 | Tragic 25.6% |
| Arapaho | 0.0 /100 | #338 | Tragic 25.6% |
| Immigrants | St. Vincent and the Grenadines | 0.0 /100 | #339 | Tragic 25.6% |