Immigrants from Somalia vs Cheyenne Family Households with Children
COMPARE
Immigrants from Somalia
Cheyenne
Family Households with Children
Family Households with Children Comparison
Immigrants from Somalia
Cheyenne
26.3%
FAMILY HOUSEHOLDS WITH CHILDREN
0.0/ 100
METRIC RATING
309th/ 347
METRIC RANK
27.4%
FAMILY HOUSEHOLDS WITH CHILDREN
35.1/ 100
METRIC RATING
196th/ 347
METRIC RANK
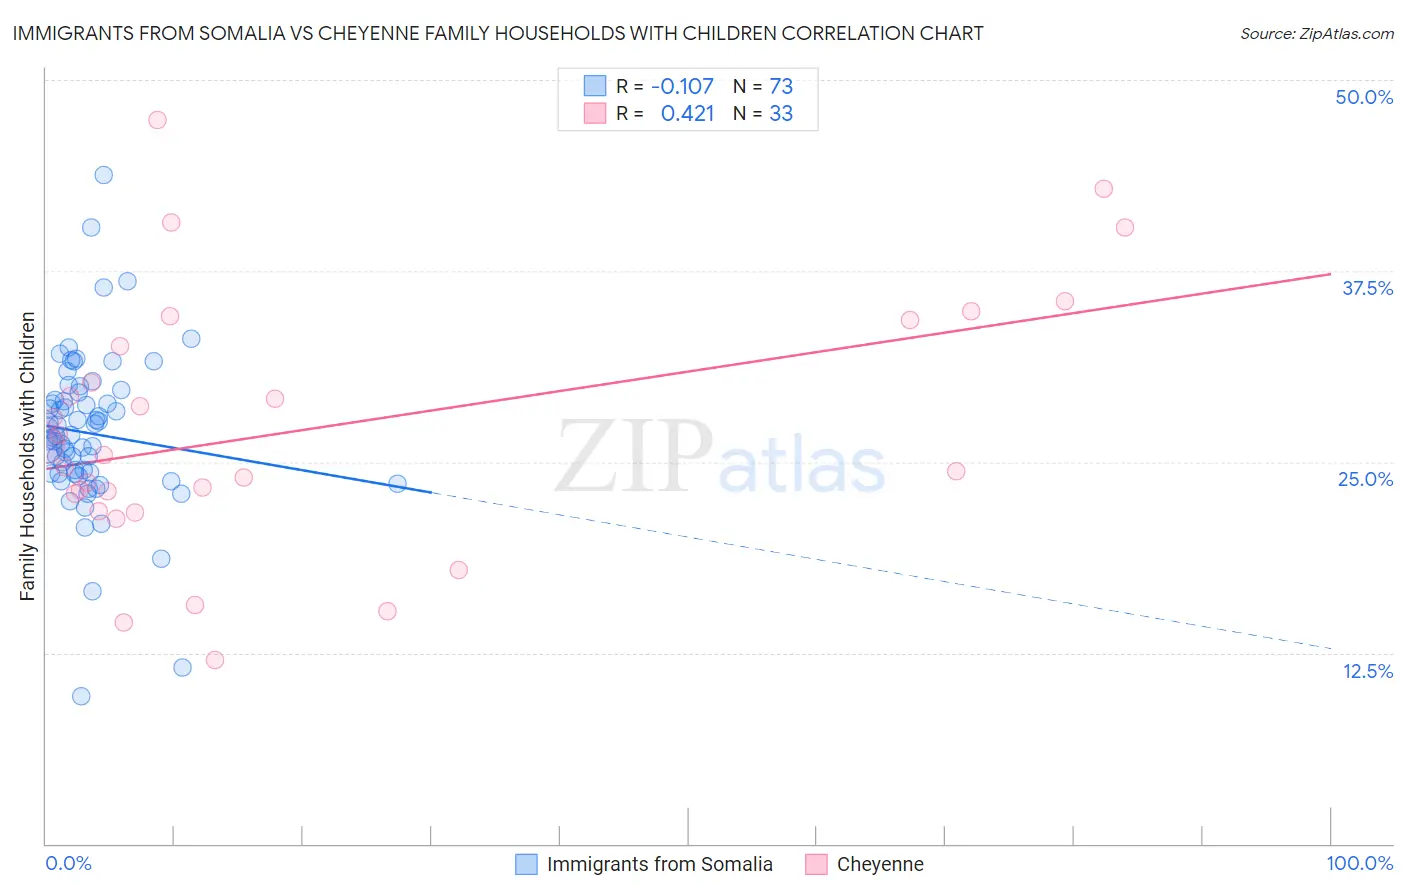
Immigrants from Somalia vs Cheyenne Family Households with Children Correlation Chart
The statistical analysis conducted on geographies consisting of 92,093,079 people shows a poor negative correlation between the proportion of Immigrants from Somalia and percentage of family households with children in the United States with a correlation coefficient (R) of -0.107 and weighted average of 26.3%. Similarly, the statistical analysis conducted on geographies consisting of 80,669,159 people shows a moderate positive correlation between the proportion of Cheyenne and percentage of family households with children in the United States with a correlation coefficient (R) of 0.421 and weighted average of 27.4%, a difference of 4.2%.
Family Households with Children Correlation Summary
| Measurement | Immigrants from Somalia | Cheyenne |
| Minimum | 9.6% | 12.0% |
| Maximum | 43.8% | 47.4% |
| Range | 34.2% | 35.3% |
| Mean | 26.9% | 27.1% |
| Median | 26.7% | 25.4% |
| Interquartile 25% (IQ1) | 24.2% | 22.4% |
| Interquartile 75% (IQ3) | 29.3% | 33.4% |
| Interquartile Range (IQR) | 5.1% | 11.1% |
| Standard Deviation (Sample) | 5.2% | 8.4% |
| Standard Deviation (Population) | 5.2% | 8.2% |
Similar Demographics by Family Households with Children
Demographics Similar to Immigrants from Somalia by Family Households with Children
In terms of family households with children, the demographic groups most similar to Immigrants from Somalia are Marshallese (26.2%, a difference of 0.050%), Colville (26.2%, a difference of 0.090%), Lumbee (26.3%, a difference of 0.11%), West Indian (26.3%, a difference of 0.13%), and Immigrants from Czechoslovakia (26.2%, a difference of 0.16%).
| Demographics | Rating | Rank | Family Households with Children |
| Serbians | 0.1 /100 | #302 | Tragic 26.4% |
| Immigrants | Guyana | 0.1 /100 | #303 | Tragic 26.3% |
| Immigrants | Bahamas | 0.1 /100 | #304 | Tragic 26.3% |
| Guyanese | 0.1 /100 | #305 | Tragic 26.3% |
| Bermudans | 0.1 /100 | #306 | Tragic 26.3% |
| West Indians | 0.0 /100 | #307 | Tragic 26.3% |
| Lumbee | 0.0 /100 | #308 | Tragic 26.3% |
| Immigrants | Somalia | 0.0 /100 | #309 | Tragic 26.3% |
| Marshallese | 0.0 /100 | #310 | Tragic 26.2% |
| Colville | 0.0 /100 | #311 | Tragic 26.2% |
| Immigrants | Czechoslovakia | 0.0 /100 | #312 | Tragic 26.2% |
| Cree | 0.0 /100 | #313 | Tragic 26.2% |
| French Canadians | 0.0 /100 | #314 | Tragic 26.1% |
| Immigrants | Norway | 0.0 /100 | #315 | Tragic 26.1% |
| Estonians | 0.0 /100 | #316 | Tragic 26.1% |
Demographics Similar to Cheyenne by Family Households with Children
In terms of family households with children, the demographic groups most similar to Cheyenne are Norwegian (27.4%, a difference of 0.0%), Immigrants from Iran (27.4%, a difference of 0.020%), Crow (27.4%, a difference of 0.020%), Immigrants from Romania (27.4%, a difference of 0.020%), and Swedish (27.4%, a difference of 0.040%).
| Demographics | Rating | Rank | Family Households with Children |
| Immigrants | Israel | 37.9 /100 | #189 | Fair 27.4% |
| Immigrants | Uruguay | 37.7 /100 | #190 | Fair 27.4% |
| Sudanese | 37.6 /100 | #191 | Fair 27.4% |
| Pennsylvania Germans | 37.5 /100 | #192 | Fair 27.4% |
| Swedes | 36.9 /100 | #193 | Fair 27.4% |
| Immigrants | Iran | 36.1 /100 | #194 | Fair 27.4% |
| Crow | 35.7 /100 | #195 | Fair 27.4% |
| Cheyenne | 35.1 /100 | #196 | Fair 27.4% |
| Norwegians | 35.0 /100 | #197 | Fair 27.4% |
| Immigrants | Romania | 34.4 /100 | #198 | Fair 27.4% |
| English | 32.0 /100 | #199 | Fair 27.3% |
| Immigrants | Congo | 28.7 /100 | #200 | Fair 27.3% |
| Bhutanese | 25.1 /100 | #201 | Fair 27.3% |
| Americans | 22.8 /100 | #202 | Fair 27.3% |
| Kiowa | 22.2 /100 | #203 | Fair 27.3% |