Native Hawaiian vs Cheyenne Family Households with Children
COMPARE
Native Hawaiian
Cheyenne
Family Households with Children
Family Households with Children Comparison
Native Hawaiians
Cheyenne
27.4%
FAMILY HOUSEHOLDS WITH CHILDREN
44.6/ 100
METRIC RATING
184th/ 347
METRIC RANK
27.4%
FAMILY HOUSEHOLDS WITH CHILDREN
35.1/ 100
METRIC RATING
196th/ 347
METRIC RANK
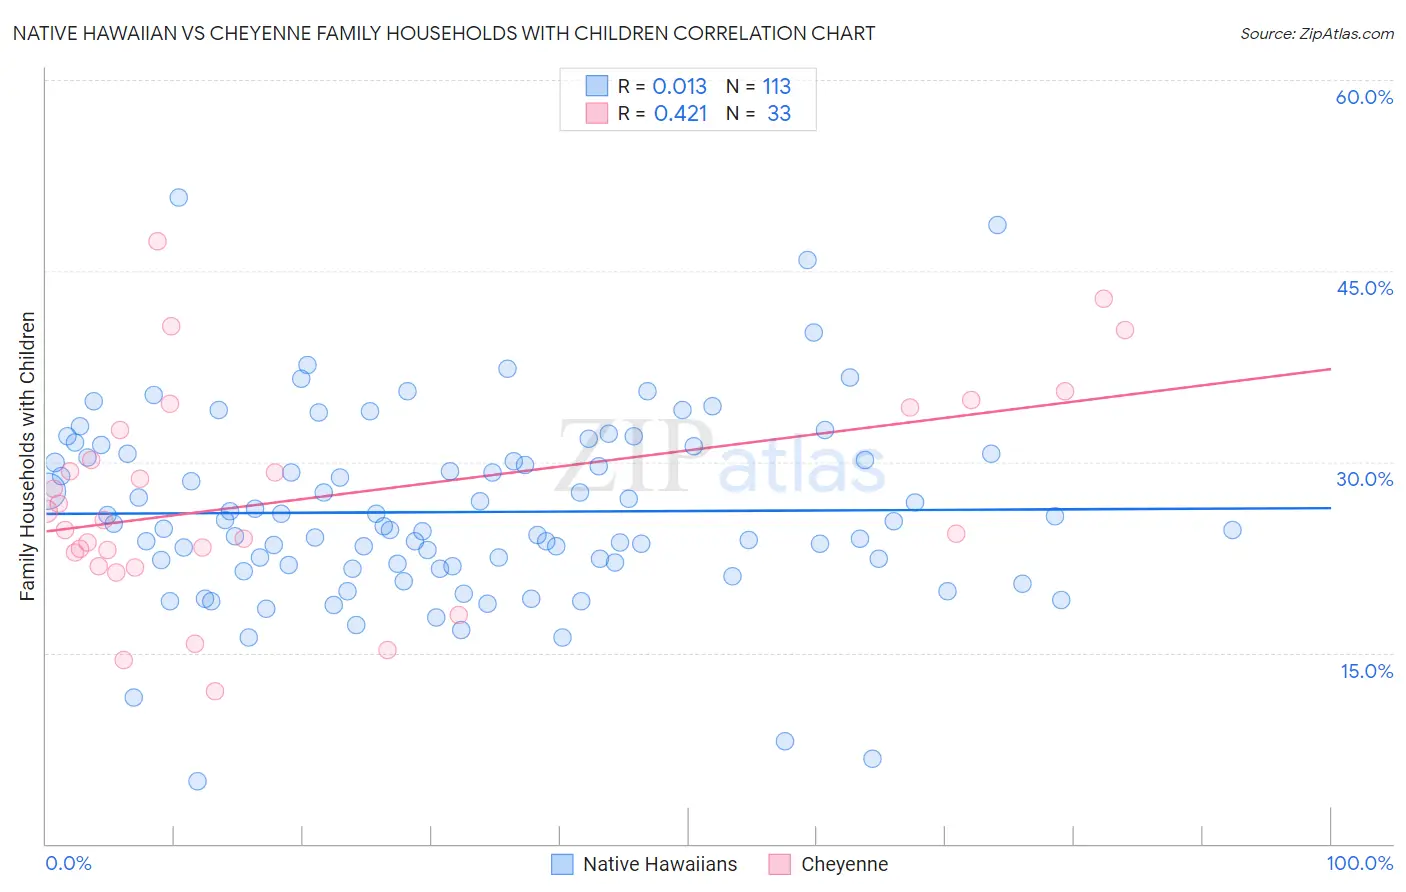
Native Hawaiian vs Cheyenne Family Households with Children Correlation Chart
The statistical analysis conducted on geographies consisting of 331,771,258 people shows no correlation between the proportion of Native Hawaiians and percentage of family households with children in the United States with a correlation coefficient (R) of 0.013 and weighted average of 27.4%. Similarly, the statistical analysis conducted on geographies consisting of 80,669,159 people shows a moderate positive correlation between the proportion of Cheyenne and percentage of family households with children in the United States with a correlation coefficient (R) of 0.421 and weighted average of 27.4%, a difference of 0.22%.
Family Households with Children Correlation Summary
| Measurement | Native Hawaiian | Cheyenne |
| Minimum | 5.0% | 12.0% |
| Maximum | 50.8% | 47.4% |
| Range | 45.9% | 35.3% |
| Mean | 26.1% | 27.1% |
| Median | 25.0% | 25.4% |
| Interquartile 25% (IQ1) | 21.9% | 22.4% |
| Interquartile 75% (IQ3) | 30.5% | 33.4% |
| Interquartile Range (IQR) | 8.6% | 11.1% |
| Standard Deviation (Sample) | 7.4% | 8.4% |
| Standard Deviation (Population) | 7.3% | 8.2% |
Demographics Similar to Native Hawaiians and Cheyenne by Family Households with Children
In terms of family households with children, the demographic groups most similar to Native Hawaiians are South African (27.4%, a difference of 0.010%), Puget Sound Salish (27.4%, a difference of 0.040%), Immigrants from Turkey (27.4%, a difference of 0.050%), Aleut (27.4%, a difference of 0.050%), and Delaware (27.4%, a difference of 0.060%). Similarly, the demographic groups most similar to Cheyenne are Norwegian (27.4%, a difference of 0.0%), Immigrants from Iran (27.4%, a difference of 0.020%), Crow (27.4%, a difference of 0.020%), Immigrants from Romania (27.4%, a difference of 0.020%), and Swedish (27.4%, a difference of 0.040%).
| Demographics | Rating | Rank | Family Households with Children |
| Immigrants | Turkey | 46.9 /100 | #180 | Average 27.4% |
| Aleuts | 46.7 /100 | #181 | Average 27.4% |
| Puget Sound Salish | 46.2 /100 | #182 | Average 27.4% |
| South Africans | 44.9 /100 | #183 | Average 27.4% |
| Native Hawaiians | 44.6 /100 | #184 | Average 27.4% |
| Delaware | 42.0 /100 | #185 | Average 27.4% |
| Immigrants | Brazil | 40.6 /100 | #186 | Average 27.4% |
| Creek | 39.8 /100 | #187 | Fair 27.4% |
| Dutch | 38.8 /100 | #188 | Fair 27.4% |
| Immigrants | Israel | 37.9 /100 | #189 | Fair 27.4% |
| Immigrants | Uruguay | 37.7 /100 | #190 | Fair 27.4% |
| Sudanese | 37.6 /100 | #191 | Fair 27.4% |
| Pennsylvania Germans | 37.5 /100 | #192 | Fair 27.4% |
| Swedes | 36.9 /100 | #193 | Fair 27.4% |
| Immigrants | Iran | 36.1 /100 | #194 | Fair 27.4% |
| Crow | 35.7 /100 | #195 | Fair 27.4% |
| Cheyenne | 35.1 /100 | #196 | Fair 27.4% |
| Norwegians | 35.0 /100 | #197 | Fair 27.4% |
| Immigrants | Romania | 34.4 /100 | #198 | Fair 27.4% |
| English | 32.0 /100 | #199 | Fair 27.3% |
| Immigrants | Congo | 28.7 /100 | #200 | Fair 27.3% |