Tlingit-Haida vs European Family Households with Children
COMPARE
Tlingit-Haida
European
Family Households with Children
Family Households with Children Comparison
Tlingit-Haida
Europeans
26.0%
FAMILY HOUSEHOLDS WITH CHILDREN
0.0/ 100
METRIC RATING
320th/ 347
METRIC RANK
27.9%
FAMILY HOUSEHOLDS WITH CHILDREN
95.4/ 100
METRIC RATING
120th/ 347
METRIC RANK
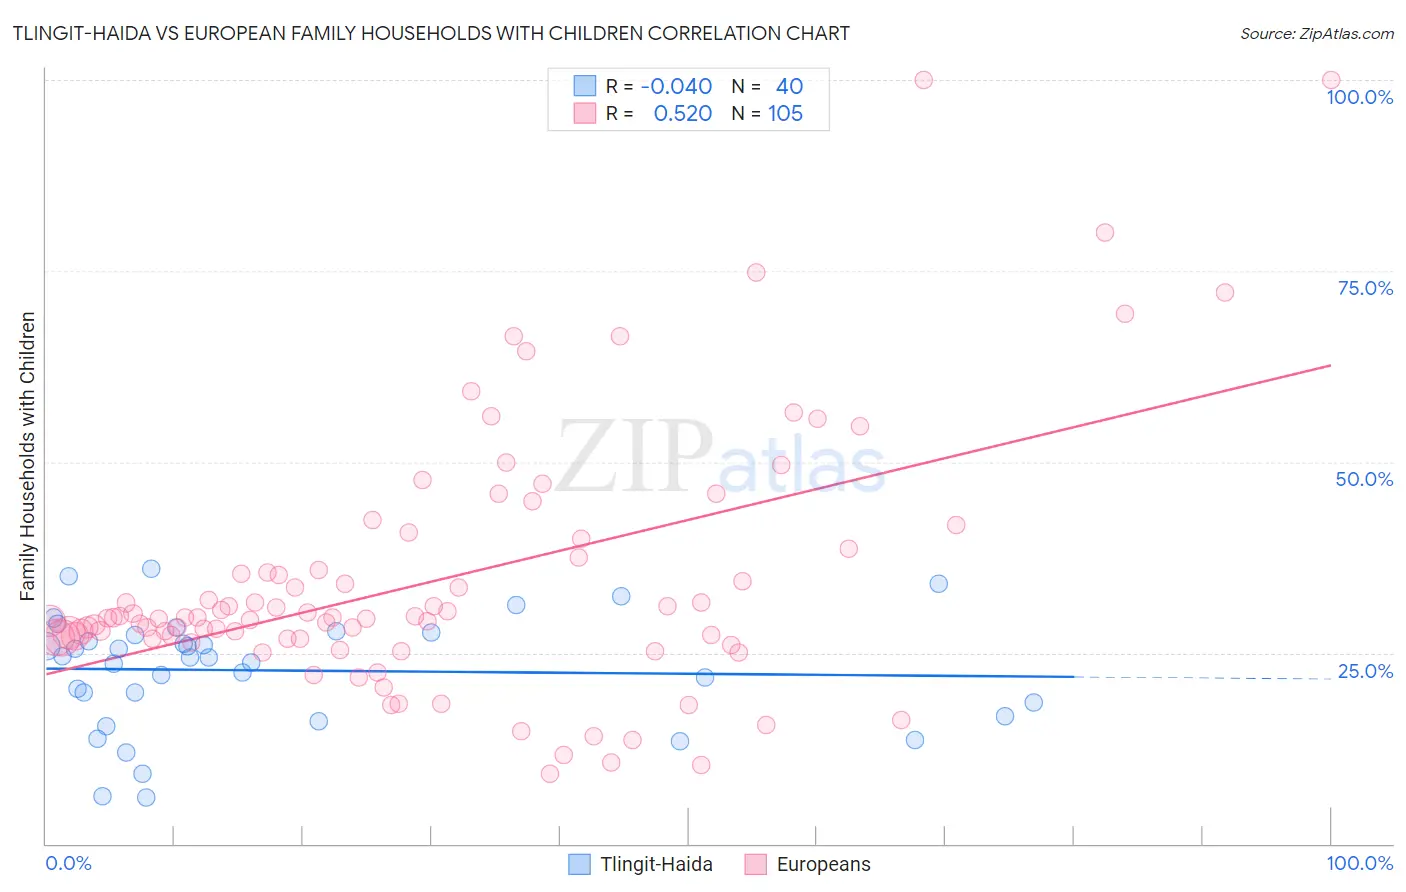
Tlingit-Haida vs European Family Households with Children Correlation Chart
The statistical analysis conducted on geographies consisting of 60,854,309 people shows no correlation between the proportion of Tlingit-Haida and percentage of family households with children in the United States with a correlation coefficient (R) of -0.040 and weighted average of 26.0%. Similarly, the statistical analysis conducted on geographies consisting of 560,876,859 people shows a substantial positive correlation between the proportion of Europeans and percentage of family households with children in the United States with a correlation coefficient (R) of 0.520 and weighted average of 27.9%, a difference of 7.2%.
Family Households with Children Correlation Summary
| Measurement | Tlingit-Haida | European |
| Minimum | 6.0% | 9.1% |
| Maximum | 36.0% | 100.0% |
| Range | 30.0% | 90.9% |
| Mean | 22.7% | 34.4% |
| Median | 24.4% | 29.6% |
| Interquartile 25% (IQ1) | 17.6% | 26.9% |
| Interquartile 75% (IQ3) | 27.6% | 38.0% |
| Interquartile Range (IQR) | 10.0% | 11.2% |
| Standard Deviation (Sample) | 7.5% | 16.9% |
| Standard Deviation (Population) | 7.4% | 16.8% |
Similar Demographics by Family Households with Children
Demographics Similar to Tlingit-Haida by Family Households with Children
In terms of family households with children, the demographic groups most similar to Tlingit-Haida are British West Indian (26.0%, a difference of 0.010%), Immigrants from France (26.0%, a difference of 0.020%), Immigrants from Greece (26.0%, a difference of 0.030%), Immigrants from Australia (26.0%, a difference of 0.060%), and Chinese (26.0%, a difference of 0.090%).
| Demographics | Rating | Rank | Family Households with Children |
| Cree | 0.0 /100 | #313 | Tragic 26.2% |
| French Canadians | 0.0 /100 | #314 | Tragic 26.1% |
| Immigrants | Norway | 0.0 /100 | #315 | Tragic 26.1% |
| Estonians | 0.0 /100 | #316 | Tragic 26.1% |
| Ottawa | 0.0 /100 | #317 | Tragic 26.1% |
| Iroquois | 0.0 /100 | #318 | Tragic 26.1% |
| Immigrants | France | 0.0 /100 | #319 | Tragic 26.0% |
| Tlingit-Haida | 0.0 /100 | #320 | Tragic 26.0% |
| British West Indians | 0.0 /100 | #321 | Tragic 26.0% |
| Immigrants | Greece | 0.0 /100 | #322 | Tragic 26.0% |
| Immigrants | Australia | 0.0 /100 | #323 | Tragic 26.0% |
| Chinese | 0.0 /100 | #324 | Tragic 26.0% |
| Barbadians | 0.0 /100 | #325 | Tragic 26.0% |
| Immigrants | Ireland | 0.0 /100 | #326 | Tragic 26.0% |
| Immigrants | Barbados | 0.0 /100 | #327 | Tragic 26.0% |
Demographics Similar to Europeans by Family Households with Children
In terms of family households with children, the demographic groups most similar to Europeans are Zimbabwean (27.9%, a difference of 0.030%), Immigrants from Malaysia (27.9%, a difference of 0.070%), Central American Indian (27.9%, a difference of 0.070%), Pakistani (27.9%, a difference of 0.080%), and Immigrants from Western Asia (27.9%, a difference of 0.19%).
| Demographics | Rating | Rank | Family Households with Children |
| Arabs | 97.0 /100 | #113 | Exceptional 28.0% |
| South American Indians | 96.9 /100 | #114 | Exceptional 28.0% |
| Immigrants | Africa | 96.8 /100 | #115 | Exceptional 28.0% |
| Pakistanis | 96.0 /100 | #116 | Exceptional 27.9% |
| Immigrants | Malaysia | 95.9 /100 | #117 | Exceptional 27.9% |
| Central American Indians | 95.9 /100 | #118 | Exceptional 27.9% |
| Zimbabweans | 95.6 /100 | #119 | Exceptional 27.9% |
| Europeans | 95.4 /100 | #120 | Exceptional 27.9% |
| Immigrants | Western Asia | 93.6 /100 | #121 | Exceptional 27.9% |
| Immigrants | Zimbabwe | 92.8 /100 | #122 | Exceptional 27.8% |
| Immigrants | Northern Africa | 91.8 /100 | #123 | Exceptional 27.8% |
| Immigrants | Singapore | 90.8 /100 | #124 | Exceptional 27.8% |
| Ecuadorians | 90.8 /100 | #125 | Exceptional 27.8% |
| Immigrants | Ethiopia | 90.5 /100 | #126 | Exceptional 27.8% |
| Belizeans | 90.0 /100 | #127 | Exceptional 27.8% |