Tlingit-Haida vs Nonimmigrants Family Households with Children
COMPARE
Tlingit-Haida
Nonimmigrants
Family Households with Children
Family Households with Children Comparison
Tlingit-Haida
Nonimmigrants
26.0%
FAMILY HOUSEHOLDS WITH CHILDREN
0.0/ 100
METRIC RATING
320th/ 347
METRIC RANK
27.5%
FAMILY HOUSEHOLDS WITH CHILDREN
61.2/ 100
METRIC RATING
166th/ 347
METRIC RANK
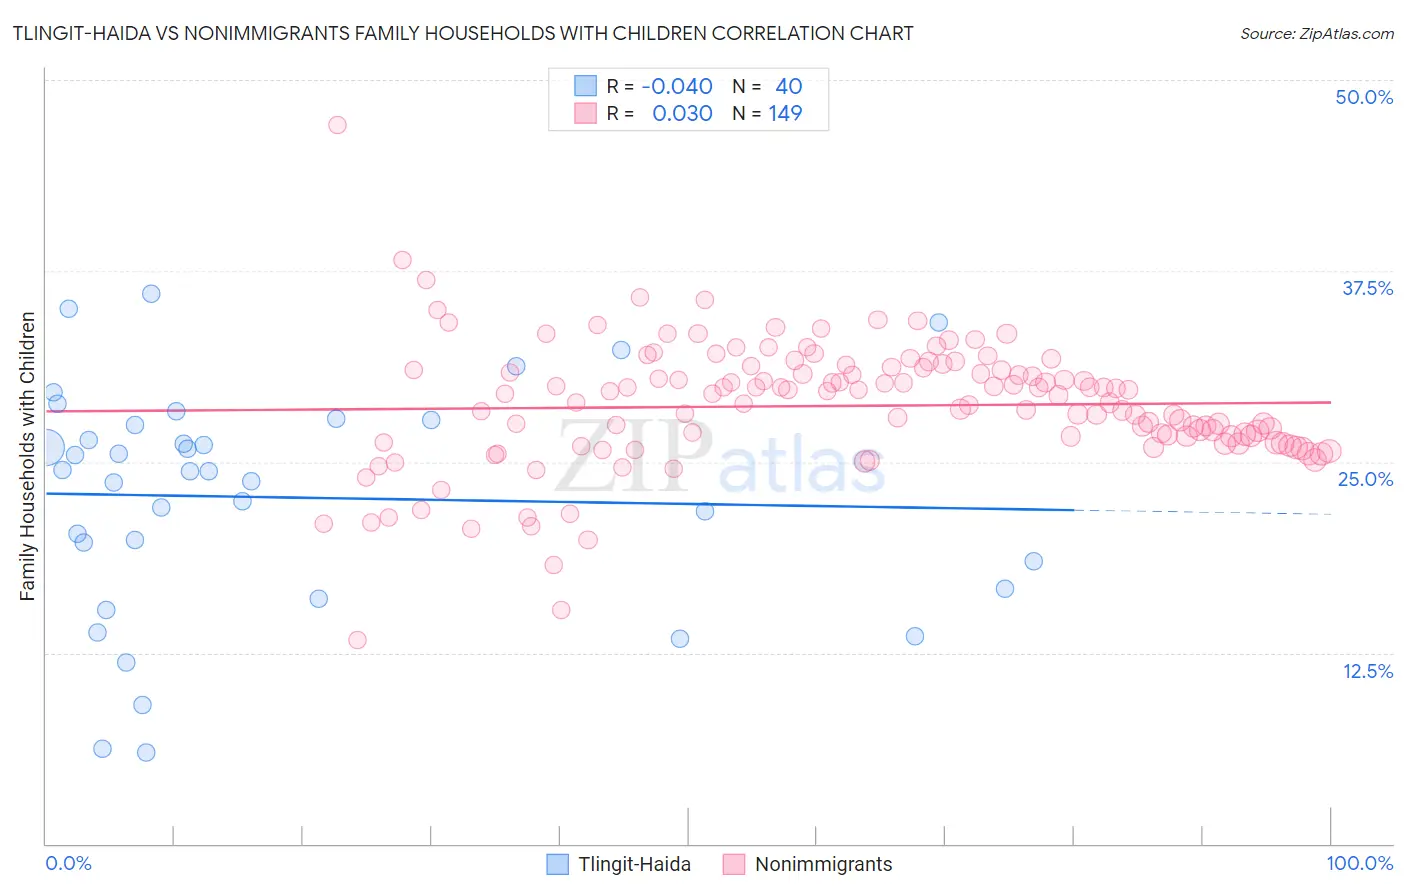
Tlingit-Haida vs Nonimmigrants Family Households with Children Correlation Chart
The statistical analysis conducted on geographies consisting of 60,854,309 people shows no correlation between the proportion of Tlingit-Haida and percentage of family households with children in the United States with a correlation coefficient (R) of -0.040 and weighted average of 26.0%. Similarly, the statistical analysis conducted on geographies consisting of 583,873,030 people shows no correlation between the proportion of Nonimmigrants and percentage of family households with children in the United States with a correlation coefficient (R) of 0.030 and weighted average of 27.5%, a difference of 5.7%.
Family Households with Children Correlation Summary
| Measurement | Tlingit-Haida | Nonimmigrants |
| Minimum | 6.0% | 13.3% |
| Maximum | 36.0% | 47.1% |
| Range | 30.0% | 33.7% |
| Mean | 22.7% | 28.7% |
| Median | 24.4% | 29.3% |
| Interquartile 25% (IQ1) | 17.6% | 26.2% |
| Interquartile 75% (IQ3) | 27.6% | 31.1% |
| Interquartile Range (IQR) | 10.0% | 4.9% |
| Standard Deviation (Sample) | 7.5% | 4.2% |
| Standard Deviation (Population) | 7.4% | 4.2% |
Similar Demographics by Family Households with Children
Demographics Similar to Tlingit-Haida by Family Households with Children
In terms of family households with children, the demographic groups most similar to Tlingit-Haida are British West Indian (26.0%, a difference of 0.010%), Immigrants from France (26.0%, a difference of 0.020%), Immigrants from Greece (26.0%, a difference of 0.030%), Immigrants from Australia (26.0%, a difference of 0.060%), and Chinese (26.0%, a difference of 0.090%).
| Demographics | Rating | Rank | Family Households with Children |
| Cree | 0.0 /100 | #313 | Tragic 26.2% |
| French Canadians | 0.0 /100 | #314 | Tragic 26.1% |
| Immigrants | Norway | 0.0 /100 | #315 | Tragic 26.1% |
| Estonians | 0.0 /100 | #316 | Tragic 26.1% |
| Ottawa | 0.0 /100 | #317 | Tragic 26.1% |
| Iroquois | 0.0 /100 | #318 | Tragic 26.1% |
| Immigrants | France | 0.0 /100 | #319 | Tragic 26.0% |
| Tlingit-Haida | 0.0 /100 | #320 | Tragic 26.0% |
| British West Indians | 0.0 /100 | #321 | Tragic 26.0% |
| Immigrants | Greece | 0.0 /100 | #322 | Tragic 26.0% |
| Immigrants | Australia | 0.0 /100 | #323 | Tragic 26.0% |
| Chinese | 0.0 /100 | #324 | Tragic 26.0% |
| Barbadians | 0.0 /100 | #325 | Tragic 26.0% |
| Immigrants | Ireland | 0.0 /100 | #326 | Tragic 26.0% |
| Immigrants | Barbados | 0.0 /100 | #327 | Tragic 26.0% |
Demographics Similar to Nonimmigrants by Family Households with Children
In terms of family households with children, the demographic groups most similar to Nonimmigrants are Immigrants from South Africa (27.5%, a difference of 0.0%), Dominican (27.5%, a difference of 0.0%), Immigrants from Kuwait (27.5%, a difference of 0.010%), Immigrants from Hong Kong (27.5%, a difference of 0.090%), and Czech (27.5%, a difference of 0.10%).
| Demographics | Rating | Rank | Family Households with Children |
| Mongolians | 70.7 /100 | #159 | Good 27.6% |
| Sub-Saharan Africans | 67.5 /100 | #160 | Good 27.6% |
| Alaskan Athabascans | 67.1 /100 | #161 | Good 27.6% |
| Immigrants | Bangladesh | 67.0 /100 | #162 | Good 27.6% |
| Czechs | 65.3 /100 | #163 | Good 27.5% |
| Immigrants | Hong Kong | 64.9 /100 | #164 | Good 27.5% |
| Immigrants | South Africa | 61.3 /100 | #165 | Good 27.5% |
| Immigrants | Nonimmigrants | 61.2 /100 | #166 | Good 27.5% |
| Dominicans | 61.1 /100 | #167 | Good 27.5% |
| Immigrants | Kuwait | 60.9 /100 | #168 | Good 27.5% |
| Seminole | 56.9 /100 | #169 | Average 27.5% |
| Cherokee | 56.7 /100 | #170 | Average 27.5% |
| Blackfeet | 54.3 /100 | #171 | Average 27.5% |
| Israelis | 53.9 /100 | #172 | Average 27.5% |
| Immigrants | Argentina | 52.2 /100 | #173 | Average 27.5% |