Thai vs Immigrants from Latvia In Labor Force | Age 20-64
COMPARE
Thai
Immigrants from Latvia
In Labor Force | Age 20-64
In Labor Force | Age 20-64 Comparison
Thais
Immigrants from Latvia
80.9%
IN LABOR FORCE | AGE 20-64
100.0/ 100
METRIC RATING
20th/ 347
METRIC RANK
80.1%
IN LABOR FORCE | AGE 20-64
97.2/ 100
METRIC RATING
84th/ 347
METRIC RANK
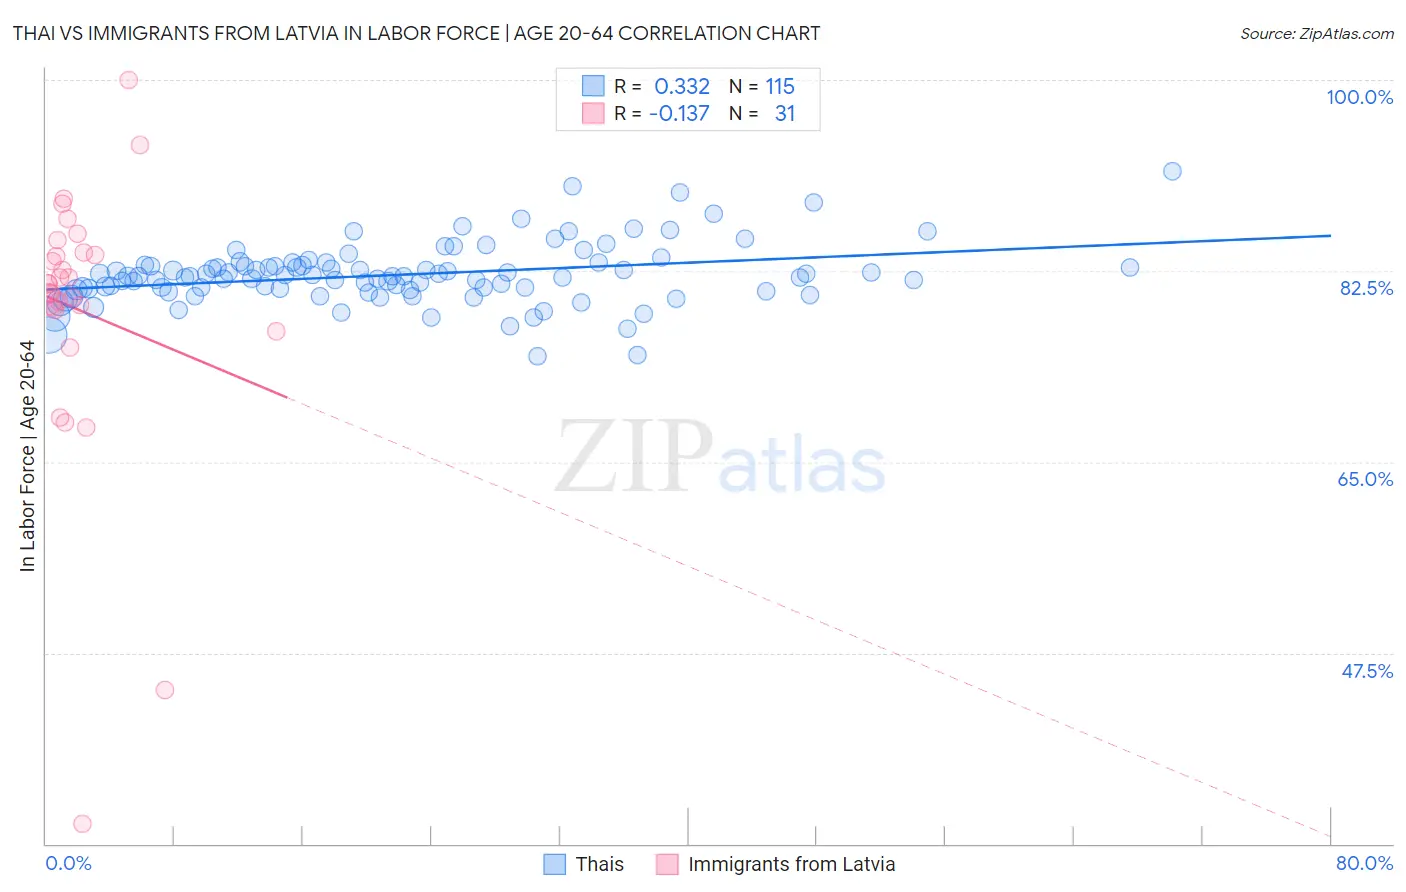
Thai vs Immigrants from Latvia In Labor Force | Age 20-64 Correlation Chart
The statistical analysis conducted on geographies consisting of 475,903,874 people shows a mild positive correlation between the proportion of Thais and labor force participation rate among population between the ages 20 and 64 in the United States with a correlation coefficient (R) of 0.332 and weighted average of 80.9%. Similarly, the statistical analysis conducted on geographies consisting of 113,735,345 people shows a poor negative correlation between the proportion of Immigrants from Latvia and labor force participation rate among population between the ages 20 and 64 in the United States with a correlation coefficient (R) of -0.137 and weighted average of 80.1%, a difference of 0.98%.
In Labor Force | Age 20-64 Correlation Summary
| Measurement | Thai | Immigrants from Latvia |
| Minimum | 74.7% | 31.8% |
| Maximum | 91.6% | 100.0% |
| Range | 16.9% | 68.2% |
| Mean | 82.2% | 78.9% |
| Median | 82.0% | 81.3% |
| Interquartile 25% (IQ1) | 80.7% | 78.9% |
| Interquartile 75% (IQ3) | 83.0% | 84.2% |
| Interquartile Range (IQR) | 2.2% | 5.3% |
| Standard Deviation (Sample) | 2.8% | 12.8% |
| Standard Deviation (Population) | 2.7% | 12.6% |
Similar Demographics by In Labor Force | Age 20-64
Demographics Similar to Thais by In Labor Force | Age 20-64
In terms of in labor force | age 20-64, the demographic groups most similar to Thais are Liberian (80.9%, a difference of 0.020%), Zimbabwean (81.0%, a difference of 0.050%), Immigrants from Bulgaria (81.0%, a difference of 0.060%), Norwegian (81.0%, a difference of 0.070%), and Sudanese (80.8%, a difference of 0.090%).
| Demographics | Rating | Rank | In Labor Force | Age 20-64 |
| Immigrants | India | 100.0 /100 | #13 | Exceptional 81.3% |
| Cambodians | 100.0 /100 | #14 | Exceptional 81.1% |
| Bulgarians | 100.0 /100 | #15 | Exceptional 81.1% |
| Immigrants | Nepal | 100.0 /100 | #16 | Exceptional 81.1% |
| Norwegians | 100.0 /100 | #17 | Exceptional 81.0% |
| Immigrants | Bulgaria | 100.0 /100 | #18 | Exceptional 81.0% |
| Zimbabweans | 100.0 /100 | #19 | Exceptional 81.0% |
| Thais | 100.0 /100 | #20 | Exceptional 80.9% |
| Liberians | 100.0 /100 | #21 | Exceptional 80.9% |
| Sudanese | 100.0 /100 | #22 | Exceptional 80.8% |
| Immigrants | Bosnia and Herzegovina | 100.0 /100 | #23 | Exceptional 80.8% |
| Immigrants | Morocco | 100.0 /100 | #24 | Exceptional 80.8% |
| Kenyans | 100.0 /100 | #25 | Exceptional 80.8% |
| Immigrants | Serbia | 100.0 /100 | #26 | Exceptional 80.8% |
| Immigrants | Kenya | 99.9 /100 | #27 | Exceptional 80.7% |
Demographics Similar to Immigrants from Latvia by In Labor Force | Age 20-64
In terms of in labor force | age 20-64, the demographic groups most similar to Immigrants from Latvia are Colombian (80.1%, a difference of 0.0%), German Russian (80.1%, a difference of 0.010%), Immigrants from Japan (80.1%, a difference of 0.010%), Jordanian (80.1%, a difference of 0.010%), and Immigrants from Egypt (80.1%, a difference of 0.010%).
| Demographics | Rating | Rank | In Labor Force | Age 20-64 |
| Immigrants | Colombia | 97.8 /100 | #77 | Exceptional 80.2% |
| Immigrants | Romania | 97.8 /100 | #78 | Exceptional 80.2% |
| Asians | 97.7 /100 | #79 | Exceptional 80.2% |
| Immigrants | Croatia | 97.6 /100 | #80 | Exceptional 80.1% |
| German Russians | 97.3 /100 | #81 | Exceptional 80.1% |
| Immigrants | Japan | 97.3 /100 | #82 | Exceptional 80.1% |
| Colombians | 97.3 /100 | #83 | Exceptional 80.1% |
| Immigrants | Latvia | 97.2 /100 | #84 | Exceptional 80.1% |
| Jordanians | 97.2 /100 | #85 | Exceptional 80.1% |
| Immigrants | Egypt | 97.1 /100 | #86 | Exceptional 80.1% |
| Croatians | 97.1 /100 | #87 | Exceptional 80.1% |
| Chileans | 97.0 /100 | #88 | Exceptional 80.1% |
| Immigrants | Venezuela | 96.8 /100 | #89 | Exceptional 80.1% |
| Poles | 96.8 /100 | #90 | Exceptional 80.1% |
| Uruguayans | 96.7 /100 | #91 | Exceptional 80.1% |