Subsaharan African vs Native Hawaiian Receiving Food Stamps
COMPARE
Subsaharan African
Native Hawaiian
Receiving Food Stamps
Receiving Food Stamps Comparison
Sub-Saharan Africans
Native Hawaiians
14.1%
RECEIVING FOOD STAMPS
0.3/ 100
METRIC RATING
255th/ 347
METRIC RANK
12.8%
RECEIVING FOOD STAMPS
6.7/ 100
METRIC RATING
215th/ 347
METRIC RANK
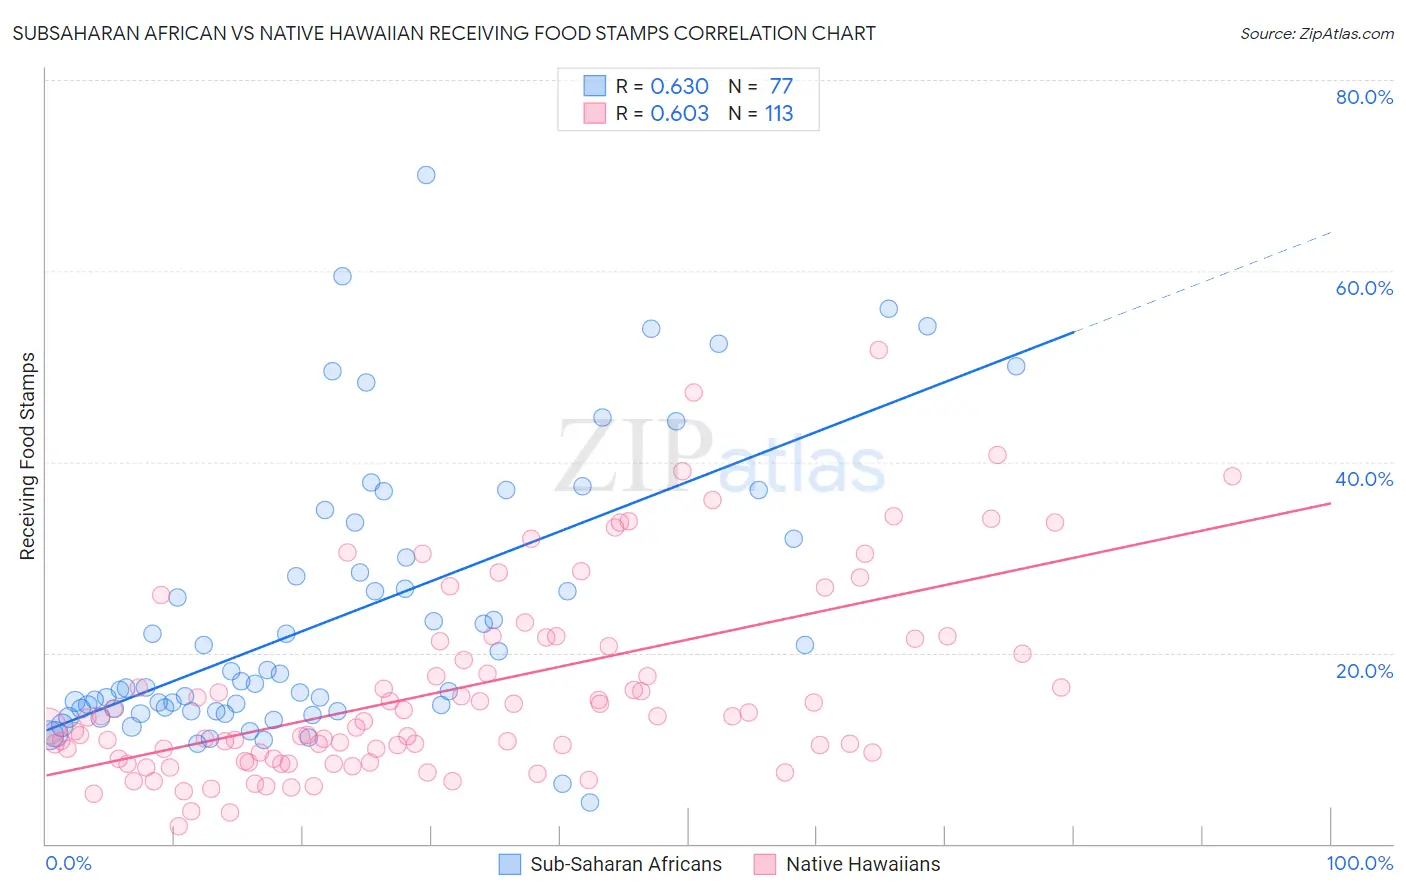
Subsaharan African vs Native Hawaiian Receiving Food Stamps Correlation Chart
The statistical analysis conducted on geographies consisting of 506,389,803 people shows a significant positive correlation between the proportion of Sub-Saharan Africans and percentage of population receiving government assistance and/or food stamps in the United States with a correlation coefficient (R) of 0.630 and weighted average of 14.1%. Similarly, the statistical analysis conducted on geographies consisting of 331,508,254 people shows a significant positive correlation between the proportion of Native Hawaiians and percentage of population receiving government assistance and/or food stamps in the United States with a correlation coefficient (R) of 0.603 and weighted average of 12.8%, a difference of 9.9%.
Receiving Food Stamps Correlation Summary
| Measurement | Subsaharan African | Native Hawaiian |
| Minimum | 4.3% | 1.9% |
| Maximum | 70.0% | 51.7% |
| Range | 65.7% | 49.8% |
| Mean | 23.8% | 16.1% |
| Median | 16.8% | 12.8% |
| Interquartile 25% (IQ1) | 13.9% | 9.0% |
| Interquartile 75% (IQ3) | 31.0% | 21.4% |
| Interquartile Range (IQR) | 17.1% | 12.4% |
| Standard Deviation (Sample) | 14.4% | 10.1% |
| Standard Deviation (Population) | 14.3% | 10.1% |
Similar Demographics by Receiving Food Stamps
Demographics Similar to Sub-Saharan Africans by Receiving Food Stamps
In terms of receiving food stamps, the demographic groups most similar to Sub-Saharan Africans are Marshallese (14.1%, a difference of 0.010%), Japanese (14.1%, a difference of 0.020%), Arapaho (14.1%, a difference of 0.12%), Immigrants from Ghana (14.1%, a difference of 0.20%), and Creek (14.1%, a difference of 0.33%).
| Demographics | Rating | Rank | Receiving Food Stamps |
| Immigrants | Laos | 0.7 /100 | #248 | Tragic 13.8% |
| Indonesians | 0.6 /100 | #249 | Tragic 13.9% |
| Immigrants | Cambodia | 0.5 /100 | #250 | Tragic 13.9% |
| Yaqui | 0.5 /100 | #251 | Tragic 13.9% |
| Ghanaians | 0.5 /100 | #252 | Tragic 14.0% |
| Spanish Americans | 0.4 /100 | #253 | Tragic 14.0% |
| Marshallese | 0.3 /100 | #254 | Tragic 14.1% |
| Sub-Saharan Africans | 0.3 /100 | #255 | Tragic 14.1% |
| Japanese | 0.3 /100 | #256 | Tragic 14.1% |
| Arapaho | 0.3 /100 | #257 | Tragic 14.1% |
| Immigrants | Ghana | 0.3 /100 | #258 | Tragic 14.1% |
| Creek | 0.3 /100 | #259 | Tragic 14.1% |
| Central Americans | 0.3 /100 | #260 | Tragic 14.1% |
| Immigrants | Congo | 0.3 /100 | #261 | Tragic 14.1% |
| Paiute | 0.2 /100 | #262 | Tragic 14.3% |
Demographics Similar to Native Hawaiians by Receiving Food Stamps
In terms of receiving food stamps, the demographic groups most similar to Native Hawaiians are Immigrants from South America (12.8%, a difference of 0.11%), Immigrants from Burma/Myanmar (12.9%, a difference of 0.36%), Immigrants from Africa (12.8%, a difference of 0.44%), Moroccan (12.8%, a difference of 0.47%), and Hawaiian (12.9%, a difference of 0.73%).
| Demographics | Rating | Rank | Receiving Food Stamps |
| Potawatomi | 14.6 /100 | #208 | Poor 12.5% |
| Immigrants | Sierra Leone | 12.9 /100 | #209 | Poor 12.5% |
| Immigrants | Uruguay | 12.8 /100 | #210 | Poor 12.5% |
| Colombians | 10.2 /100 | #211 | Poor 12.6% |
| Malaysians | 8.5 /100 | #212 | Tragic 12.7% |
| Moroccans | 7.6 /100 | #213 | Tragic 12.8% |
| Immigrants | Africa | 7.6 /100 | #214 | Tragic 12.8% |
| Native Hawaiians | 6.7 /100 | #215 | Tragic 12.8% |
| Immigrants | South America | 6.5 /100 | #216 | Tragic 12.8% |
| Immigrants | Burma/Myanmar | 6.0 /100 | #217 | Tragic 12.9% |
| Hawaiians | 5.4 /100 | #218 | Tragic 12.9% |
| Immigrants | Middle Africa | 5.4 /100 | #219 | Tragic 12.9% |
| Immigrants | Colombia | 5.3 /100 | #220 | Tragic 12.9% |
| Bermudans | 4.8 /100 | #221 | Tragic 13.0% |
| Immigrants | Immigrants | 4.4 /100 | #222 | Tragic 13.0% |