Immigrants from Cuba vs Native Hawaiian Births to Unmarried Women
COMPARE
Immigrants from Cuba
Native Hawaiian
Births to Unmarried Women
Births to Unmarried Women Comparison
Immigrants from Cuba
Native Hawaiians
41.5%
BIRTHS TO UNMARRIED WOMEN
0.0/ 100
METRIC RATING
326th/ 347
METRIC RANK
34.3%
BIRTHS TO UNMARRIED WOMEN
2.9/ 100
METRIC RATING
231st/ 347
METRIC RANK
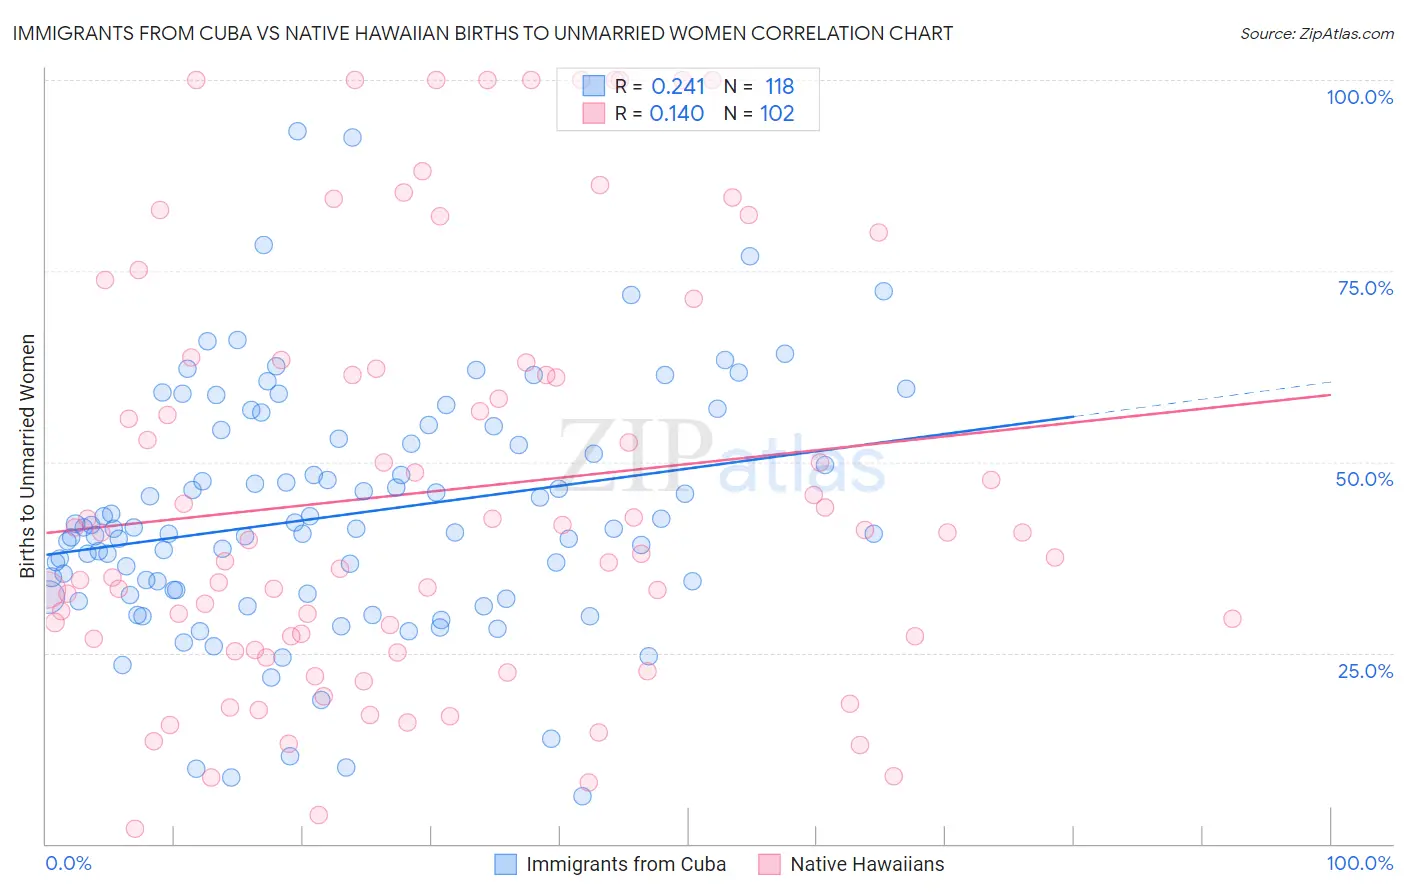
Immigrants from Cuba vs Native Hawaiian Births to Unmarried Women Correlation Chart
The statistical analysis conducted on geographies consisting of 308,833,039 people shows a weak positive correlation between the proportion of Immigrants from Cuba and percentage of births to unmarried women in the United States with a correlation coefficient (R) of 0.241 and weighted average of 41.5%. Similarly, the statistical analysis conducted on geographies consisting of 315,286,073 people shows a poor positive correlation between the proportion of Native Hawaiians and percentage of births to unmarried women in the United States with a correlation coefficient (R) of 0.140 and weighted average of 34.3%, a difference of 20.9%.
Births to Unmarried Women Correlation Summary
| Measurement | Immigrants from Cuba | Native Hawaiian |
| Minimum | 6.3% | 1.9% |
| Maximum | 93.3% | 100.0% |
| Range | 87.0% | 98.1% |
| Mean | 43.0% | 46.1% |
| Median | 41.2% | 40.2% |
| Interquartile 25% (IQ1) | 32.8% | 26.8% |
| Interquartile 75% (IQ3) | 53.1% | 62.2% |
| Interquartile Range (IQR) | 20.3% | 35.4% |
| Standard Deviation (Sample) | 15.9% | 27.3% |
| Standard Deviation (Population) | 15.8% | 27.1% |
Similar Demographics by Births to Unmarried Women
Demographics Similar to Immigrants from Cuba by Births to Unmarried Women
In terms of births to unmarried women, the demographic groups most similar to Immigrants from Cuba are Cheyenne (41.3%, a difference of 0.27%), Cape Verdean (41.3%, a difference of 0.33%), Sioux (41.0%, a difference of 1.1%), Cajun (41.0%, a difference of 1.2%), and Tsimshian (42.2%, a difference of 1.7%).
| Demographics | Rating | Rank | Births to Unmarried Women |
| Yakama | 0.0 /100 | #319 | Tragic 40.3% |
| Crow | 0.0 /100 | #320 | Tragic 40.4% |
| Bahamians | 0.0 /100 | #321 | Tragic 40.8% |
| Cajuns | 0.0 /100 | #322 | Tragic 41.0% |
| Sioux | 0.0 /100 | #323 | Tragic 41.0% |
| Cape Verdeans | 0.0 /100 | #324 | Tragic 41.3% |
| Cheyenne | 0.0 /100 | #325 | Tragic 41.3% |
| Immigrants | Cuba | 0.0 /100 | #326 | Tragic 41.5% |
| Tsimshian | 0.0 /100 | #327 | Tragic 42.2% |
| Immigrants | Cabo Verde | 0.0 /100 | #328 | Tragic 42.2% |
| Paiute | 0.0 /100 | #329 | Tragic 42.5% |
| Chippewa | 0.0 /100 | #330 | Tragic 42.6% |
| Natives/Alaskans | 0.0 /100 | #331 | Tragic 43.0% |
| Kiowa | 0.0 /100 | #332 | Tragic 43.1% |
| Blacks/African Americans | 0.0 /100 | #333 | Tragic 44.3% |
Demographics Similar to Native Hawaiians by Births to Unmarried Women
In terms of births to unmarried women, the demographic groups most similar to Native Hawaiians are Ghanaian (34.3%, a difference of 0.14%), Immigrants from Sierra Leone (34.2%, a difference of 0.17%), Panamanian (34.2%, a difference of 0.28%), French Canadian (34.4%, a difference of 0.30%), and Immigrants from Panama (34.2%, a difference of 0.31%).
| Demographics | Rating | Rank | Births to Unmarried Women |
| Immigrants | Laos | 4.3 /100 | #224 | Tragic 34.0% |
| Spanish | 4.0 /100 | #225 | Tragic 34.1% |
| Delaware | 3.3 /100 | #226 | Tragic 34.2% |
| Immigrants | Panama | 3.3 /100 | #227 | Tragic 34.2% |
| Panamanians | 3.3 /100 | #228 | Tragic 34.2% |
| Immigrants | Sierra Leone | 3.1 /100 | #229 | Tragic 34.2% |
| Ghanaians | 3.1 /100 | #230 | Tragic 34.3% |
| Native Hawaiians | 2.9 /100 | #231 | Tragic 34.3% |
| French Canadians | 2.5 /100 | #232 | Tragic 34.4% |
| Bangladeshis | 2.5 /100 | #233 | Tragic 34.4% |
| Immigrants | Zaire | 2.3 /100 | #234 | Tragic 34.5% |
| Immigrants | Ghana | 2.2 /100 | #235 | Tragic 34.5% |
| Immigrants | Cameroon | 1.6 /100 | #236 | Tragic 34.7% |
| Marshallese | 1.6 /100 | #237 | Tragic 34.8% |
| Immigrants | Cambodia | 1.6 /100 | #238 | Tragic 34.8% |