Albanian vs Native Hawaiian Births to Unmarried Women
COMPARE
Albanian
Native Hawaiian
Births to Unmarried Women
Births to Unmarried Women Comparison
Albanians
Native Hawaiians
28.5%
BIRTHS TO UNMARRIED WOMEN
98.5/ 100
METRIC RATING
73rd/ 347
METRIC RANK
34.3%
BIRTHS TO UNMARRIED WOMEN
2.9/ 100
METRIC RATING
231st/ 347
METRIC RANK
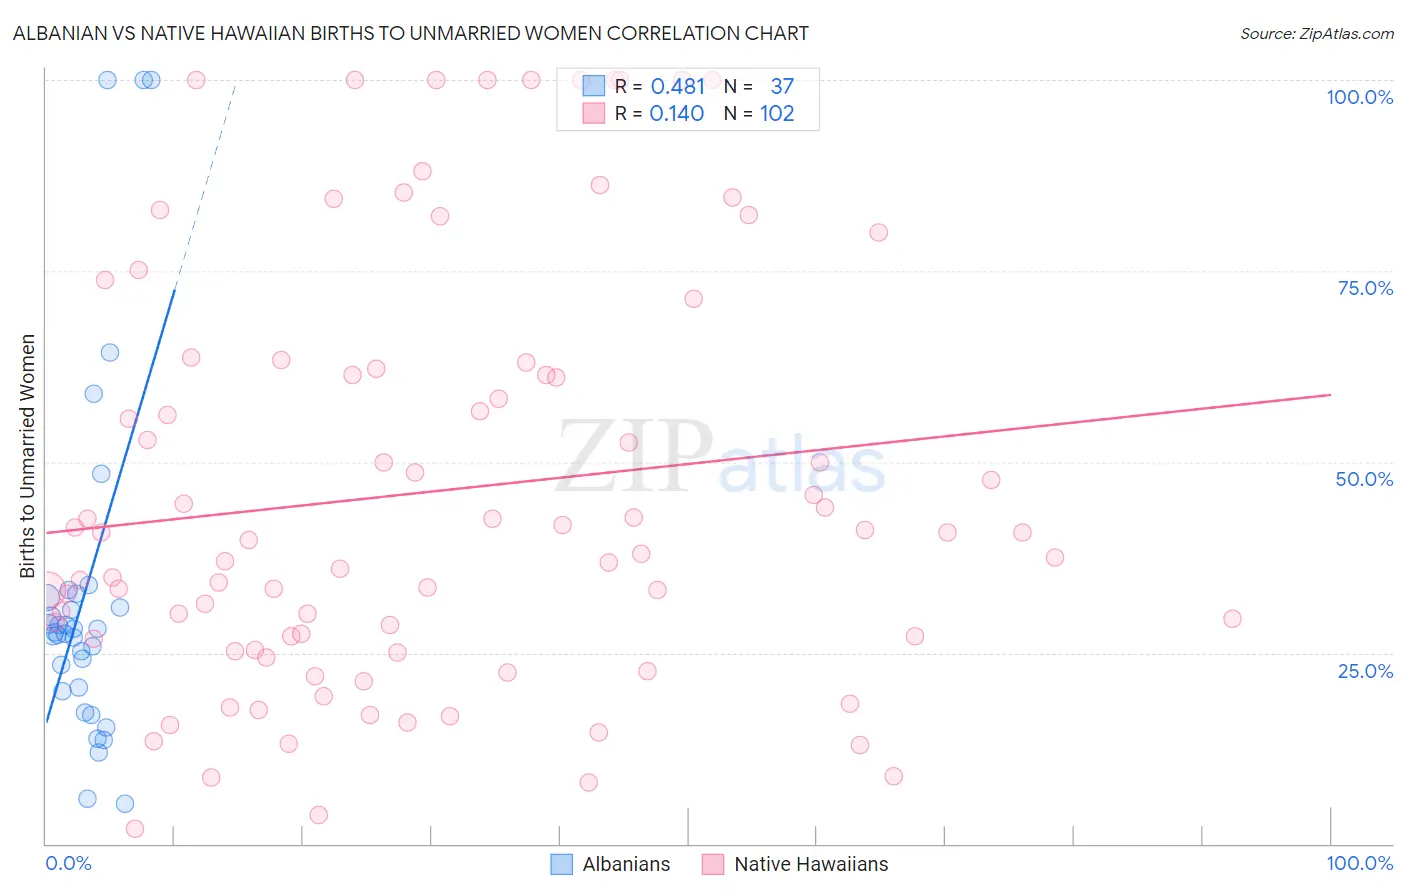
Albanian vs Native Hawaiian Births to Unmarried Women Correlation Chart
The statistical analysis conducted on geographies consisting of 182,909,720 people shows a moderate positive correlation between the proportion of Albanians and percentage of births to unmarried women in the United States with a correlation coefficient (R) of 0.481 and weighted average of 28.5%. Similarly, the statistical analysis conducted on geographies consisting of 315,286,073 people shows a poor positive correlation between the proportion of Native Hawaiians and percentage of births to unmarried women in the United States with a correlation coefficient (R) of 0.140 and weighted average of 34.3%, a difference of 20.1%.
Births to Unmarried Women Correlation Summary
| Measurement | Albanian | Native Hawaiian |
| Minimum | 5.2% | 1.9% |
| Maximum | 100.0% | 100.0% |
| Range | 94.8% | 98.1% |
| Mean | 32.8% | 46.1% |
| Median | 27.7% | 40.2% |
| Interquartile 25% (IQ1) | 20.2% | 26.8% |
| Interquartile 75% (IQ3) | 32.5% | 62.2% |
| Interquartile Range (IQR) | 12.3% | 35.4% |
| Standard Deviation (Sample) | 23.4% | 27.3% |
| Standard Deviation (Population) | 23.1% | 27.1% |
Similar Demographics by Births to Unmarried Women
Demographics Similar to Albanians by Births to Unmarried Women
In terms of births to unmarried women, the demographic groups most similar to Albanians are Immigrants from Bolivia (28.6%, a difference of 0.020%), Immigrants from Sweden (28.5%, a difference of 0.050%), Jordanian (28.5%, a difference of 0.11%), Immigrants from Switzerland (28.6%, a difference of 0.11%), and Israeli (28.6%, a difference of 0.13%).
| Demographics | Rating | Rank | Births to Unmarried Women |
| Immigrants | Egypt | 98.8 /100 | #66 | Exceptional 28.4% |
| Palestinians | 98.7 /100 | #67 | Exceptional 28.4% |
| Immigrants | Europe | 98.7 /100 | #68 | Exceptional 28.4% |
| Bolivians | 98.7 /100 | #69 | Exceptional 28.5% |
| Laotians | 98.6 /100 | #70 | Exceptional 28.5% |
| Jordanians | 98.5 /100 | #71 | Exceptional 28.5% |
| Immigrants | Sweden | 98.5 /100 | #72 | Exceptional 28.5% |
| Albanians | 98.5 /100 | #73 | Exceptional 28.5% |
| Immigrants | Bolivia | 98.5 /100 | #74 | Exceptional 28.6% |
| Immigrants | Switzerland | 98.4 /100 | #75 | Exceptional 28.6% |
| Israelis | 98.4 /100 | #76 | Exceptional 28.6% |
| Immigrants | Northern Europe | 98.3 /100 | #77 | Exceptional 28.6% |
| Zimbabweans | 98.2 /100 | #78 | Exceptional 28.7% |
| Danes | 98.2 /100 | #79 | Exceptional 28.7% |
| Immigrants | Afghanistan | 98.1 /100 | #80 | Exceptional 28.7% |
Demographics Similar to Native Hawaiians by Births to Unmarried Women
In terms of births to unmarried women, the demographic groups most similar to Native Hawaiians are Ghanaian (34.3%, a difference of 0.14%), Immigrants from Sierra Leone (34.2%, a difference of 0.17%), Panamanian (34.2%, a difference of 0.28%), French Canadian (34.4%, a difference of 0.30%), and Immigrants from Panama (34.2%, a difference of 0.31%).
| Demographics | Rating | Rank | Births to Unmarried Women |
| Immigrants | Laos | 4.3 /100 | #224 | Tragic 34.0% |
| Spanish | 4.0 /100 | #225 | Tragic 34.1% |
| Delaware | 3.3 /100 | #226 | Tragic 34.2% |
| Immigrants | Panama | 3.3 /100 | #227 | Tragic 34.2% |
| Panamanians | 3.3 /100 | #228 | Tragic 34.2% |
| Immigrants | Sierra Leone | 3.1 /100 | #229 | Tragic 34.2% |
| Ghanaians | 3.1 /100 | #230 | Tragic 34.3% |
| Native Hawaiians | 2.9 /100 | #231 | Tragic 34.3% |
| French Canadians | 2.5 /100 | #232 | Tragic 34.4% |
| Bangladeshis | 2.5 /100 | #233 | Tragic 34.4% |
| Immigrants | Zaire | 2.3 /100 | #234 | Tragic 34.5% |
| Immigrants | Ghana | 2.2 /100 | #235 | Tragic 34.5% |
| Immigrants | Cameroon | 1.6 /100 | #236 | Tragic 34.7% |
| Marshallese | 1.6 /100 | #237 | Tragic 34.8% |
| Immigrants | Cambodia | 1.6 /100 | #238 | Tragic 34.8% |