Immigrants from Lebanon vs Immigrants from Oceania Average Family Size
COMPARE
Immigrants from Lebanon
Immigrants from Oceania
Average Family Size
Average Family Size Comparison
Immigrants from Lebanon
Immigrants from Oceania
3.30
AVERAGE FAMILY SIZE
99.0/ 100
METRIC RATING
95th/ 347
METRIC RANK
3.29
AVERAGE FAMILY SIZE
98.7/ 100
METRIC RATING
97th/ 347
METRIC RANK
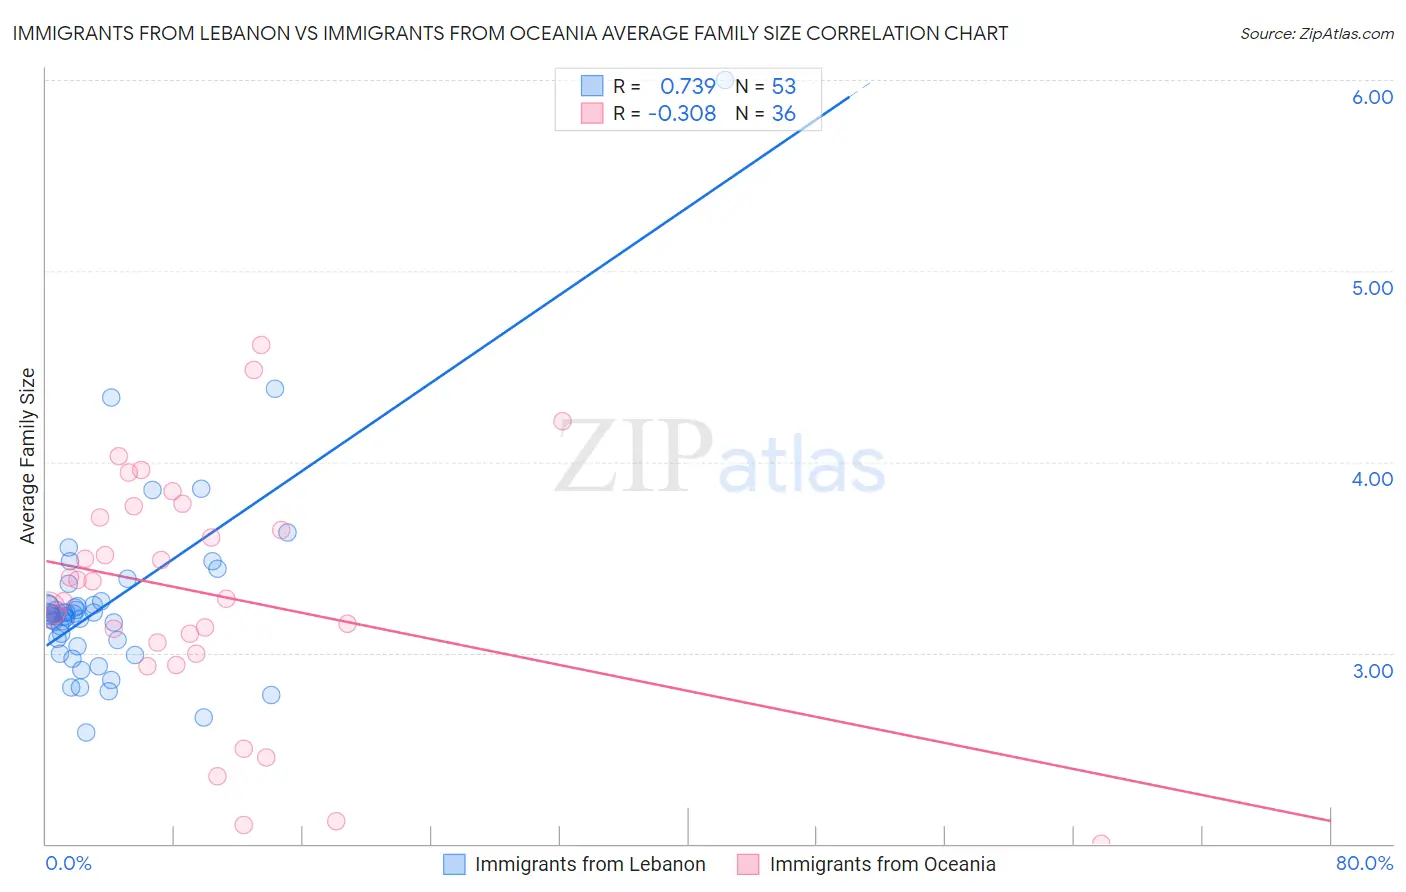
Immigrants from Lebanon vs Immigrants from Oceania Average Family Size Correlation Chart
The statistical analysis conducted on geographies consisting of 217,130,535 people shows a strong positive correlation between the proportion of Immigrants from Lebanon and average family size in the United States with a correlation coefficient (R) of 0.739 and weighted average of 3.30. Similarly, the statistical analysis conducted on geographies consisting of 305,389,085 people shows a mild negative correlation between the proportion of Immigrants from Oceania and average family size in the United States with a correlation coefficient (R) of -0.308 and weighted average of 3.29, a difference of 0.12%.
Average Family Size Correlation Summary
| Measurement | Immigrants from Lebanon | Immigrants from Oceania |
| Minimum | 2.58 | 2.00 |
| Maximum | 6.00 | 4.61 |
| Range | 3.42 | 2.61 |
| Mean | 3.27 | 3.31 |
| Median | 3.20 | 3.33 |
| Interquartile 25% (IQ1) | 3.05 | 3.02 |
| Interquartile 75% (IQ3) | 3.26 | 3.74 |
| Interquartile Range (IQR) | 0.21 | 0.71 |
| Standard Deviation (Sample) | 0.51 | 0.63 |
| Standard Deviation (Population) | 0.51 | 0.62 |
Demographics Similar to Immigrants from Lebanon and Immigrants from Oceania by Average Family Size
In terms of average family size, the demographic groups most similar to Immigrants from Lebanon are Sierra Leonean (3.30, a difference of 0.010%), U.S. Virgin Islander (3.29, a difference of 0.080%), Peruvian (3.30, a difference of 0.11%), Immigrants from Cameroon (3.30, a difference of 0.12%), and Barbadian (3.29, a difference of 0.12%). Similarly, the demographic groups most similar to Immigrants from Oceania are Barbadian (3.29, a difference of 0.0%), Nigerian (3.29, a difference of 0.010%), Guamanian/Chamorro (3.29, a difference of 0.010%), Immigrants from Burma/Myanmar (3.29, a difference of 0.030%), and U.S. Virgin Islander (3.29, a difference of 0.040%).
| Demographics | Rating | Rank | Average Family Size |
| Jamaicans | 99.7 /100 | #86 | Exceptional 3.31 |
| Immigrants | Peru | 99.7 /100 | #87 | Exceptional 3.31 |
| Immigrants | Bolivia | 99.6 /100 | #88 | Exceptional 3.31 |
| Malaysians | 99.6 /100 | #89 | Exceptional 3.31 |
| Menominee | 99.4 /100 | #90 | Exceptional 3.30 |
| Immigrants | Pakistan | 99.2 /100 | #91 | Exceptional 3.30 |
| Immigrants | Cameroon | 99.2 /100 | #92 | Exceptional 3.30 |
| Peruvians | 99.2 /100 | #93 | Exceptional 3.30 |
| Sierra Leoneans | 99.0 /100 | #94 | Exceptional 3.30 |
| Immigrants | Lebanon | 99.0 /100 | #95 | Exceptional 3.30 |
| U.S. Virgin Islanders | 98.8 /100 | #96 | Exceptional 3.29 |
| Immigrants | Oceania | 98.7 /100 | #97 | Exceptional 3.29 |
| Barbadians | 98.6 /100 | #98 | Exceptional 3.29 |
| Nigerians | 98.6 /100 | #99 | Exceptional 3.29 |
| Guamanians/Chamorros | 98.6 /100 | #100 | Exceptional 3.29 |
| Immigrants | Burma/Myanmar | 98.6 /100 | #101 | Exceptional 3.29 |
| West Indians | 98.5 /100 | #102 | Exceptional 3.29 |
| Immigrants | Western Africa | 98.4 /100 | #103 | Exceptional 3.29 |
| Bolivians | 98.3 /100 | #104 | Exceptional 3.29 |
| Immigrants | Ghana | 98.1 /100 | #105 | Exceptional 3.29 |
| Paiute | 98.0 /100 | #106 | Exceptional 3.29 |