Mexican American Indian vs Immigrants from Oceania Average Family Size
COMPARE
Mexican American Indian
Immigrants from Oceania
Average Family Size
Average Family Size Comparison
Mexican American Indians
Immigrants from Oceania
3.43
AVERAGE FAMILY SIZE
100.0/ 100
METRIC RATING
27th/ 347
METRIC RANK
3.29
AVERAGE FAMILY SIZE
98.7/ 100
METRIC RATING
97th/ 347
METRIC RANK
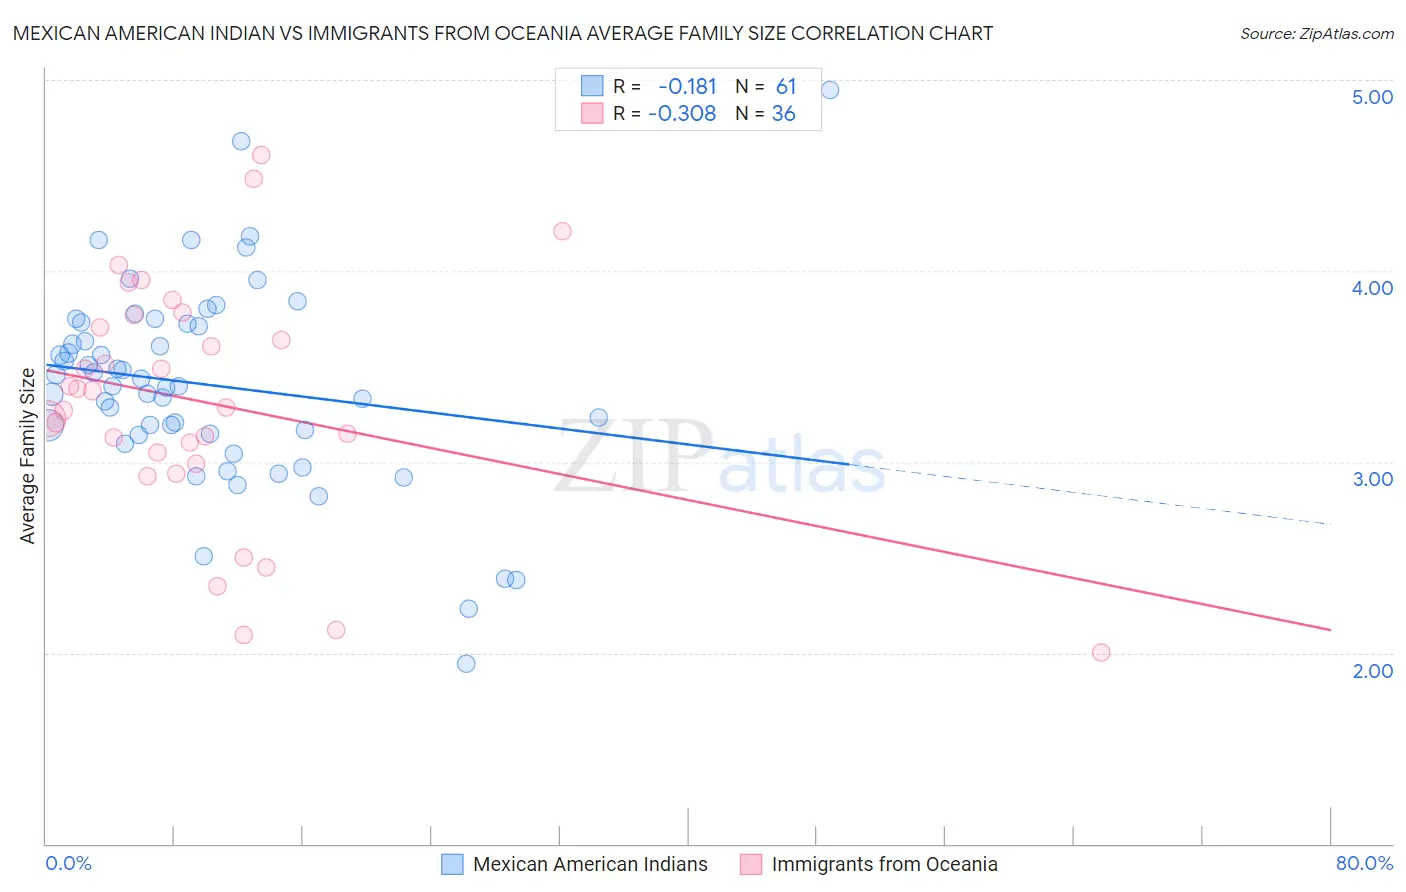
Mexican American Indian vs Immigrants from Oceania Average Family Size Correlation Chart
The statistical analysis conducted on geographies consisting of 317,496,069 people shows a poor negative correlation between the proportion of Mexican American Indians and average family size in the United States with a correlation coefficient (R) of -0.181 and weighted average of 3.43. Similarly, the statistical analysis conducted on geographies consisting of 305,389,085 people shows a mild negative correlation between the proportion of Immigrants from Oceania and average family size in the United States with a correlation coefficient (R) of -0.308 and weighted average of 3.29, a difference of 4.2%.
Average Family Size Correlation Summary
| Measurement | Mexican American Indian | Immigrants from Oceania |
| Minimum | 1.94 | 2.00 |
| Maximum | 4.95 | 4.61 |
| Range | 3.01 | 2.61 |
| Mean | 3.40 | 3.31 |
| Median | 3.40 | 3.33 |
| Interquartile 25% (IQ1) | 3.15 | 3.02 |
| Interquartile 75% (IQ3) | 3.73 | 3.74 |
| Interquartile Range (IQR) | 0.58 | 0.71 |
| Standard Deviation (Sample) | 0.53 | 0.63 |
| Standard Deviation (Population) | 0.53 | 0.62 |
Similar Demographics by Average Family Size
Demographics Similar to Mexican American Indians by Average Family Size
In terms of average family size, the demographic groups most similar to Mexican American Indians are Native Hawaiian (3.43, a difference of 0.010%), Immigrants from Latin America (3.42, a difference of 0.12%), Nepalese (3.42, a difference of 0.21%), Samoan (3.42, a difference of 0.24%), and Central American (3.41, a difference of 0.44%).
| Demographics | Rating | Rank | Average Family Size |
| Cheyenne | 100.0 /100 | #20 | Exceptional 3.47 |
| Yuman | 100.0 /100 | #21 | Exceptional 3.47 |
| Apache | 100.0 /100 | #22 | Exceptional 3.46 |
| Immigrants | Fiji | 100.0 /100 | #23 | Exceptional 3.45 |
| Natives/Alaskans | 100.0 /100 | #24 | Exceptional 3.45 |
| Yakama | 100.0 /100 | #25 | Exceptional 3.45 |
| Native Hawaiians | 100.0 /100 | #26 | Exceptional 3.43 |
| Mexican American Indians | 100.0 /100 | #27 | Exceptional 3.43 |
| Immigrants | Latin America | 100.0 /100 | #28 | Exceptional 3.42 |
| Nepalese | 100.0 /100 | #29 | Exceptional 3.42 |
| Samoans | 100.0 /100 | #30 | Exceptional 3.42 |
| Central Americans | 100.0 /100 | #31 | Exceptional 3.41 |
| Immigrants | Guatemala | 100.0 /100 | #32 | Exceptional 3.41 |
| Hawaiians | 100.0 /100 | #33 | Exceptional 3.41 |
| Hispanics or Latinos | 100.0 /100 | #34 | Exceptional 3.41 |
Demographics Similar to Immigrants from Oceania by Average Family Size
In terms of average family size, the demographic groups most similar to Immigrants from Oceania are Barbadian (3.29, a difference of 0.0%), Nigerian (3.29, a difference of 0.010%), Guamanian/Chamorro (3.29, a difference of 0.010%), Immigrants from Burma/Myanmar (3.29, a difference of 0.030%), and U.S. Virgin Islander (3.29, a difference of 0.040%).
| Demographics | Rating | Rank | Average Family Size |
| Menominee | 99.4 /100 | #90 | Exceptional 3.30 |
| Immigrants | Pakistan | 99.2 /100 | #91 | Exceptional 3.30 |
| Immigrants | Cameroon | 99.2 /100 | #92 | Exceptional 3.30 |
| Peruvians | 99.2 /100 | #93 | Exceptional 3.30 |
| Sierra Leoneans | 99.0 /100 | #94 | Exceptional 3.30 |
| Immigrants | Lebanon | 99.0 /100 | #95 | Exceptional 3.30 |
| U.S. Virgin Islanders | 98.8 /100 | #96 | Exceptional 3.29 |
| Immigrants | Oceania | 98.7 /100 | #97 | Exceptional 3.29 |
| Barbadians | 98.6 /100 | #98 | Exceptional 3.29 |
| Nigerians | 98.6 /100 | #99 | Exceptional 3.29 |
| Guamanians/Chamorros | 98.6 /100 | #100 | Exceptional 3.29 |
| Immigrants | Burma/Myanmar | 98.6 /100 | #101 | Exceptional 3.29 |
| West Indians | 98.5 /100 | #102 | Exceptional 3.29 |
| Immigrants | Western Africa | 98.4 /100 | #103 | Exceptional 3.29 |
| Bolivians | 98.3 /100 | #104 | Exceptional 3.29 |