Celtic vs Immigrants from Oceania Average Family Size
COMPARE
Celtic
Immigrants from Oceania
Average Family Size
Average Family Size Comparison
Celtics
Immigrants from Oceania
3.11
AVERAGE FAMILY SIZE
0.0/ 100
METRIC RATING
324th/ 347
METRIC RANK
3.29
AVERAGE FAMILY SIZE
98.7/ 100
METRIC RATING
97th/ 347
METRIC RANK
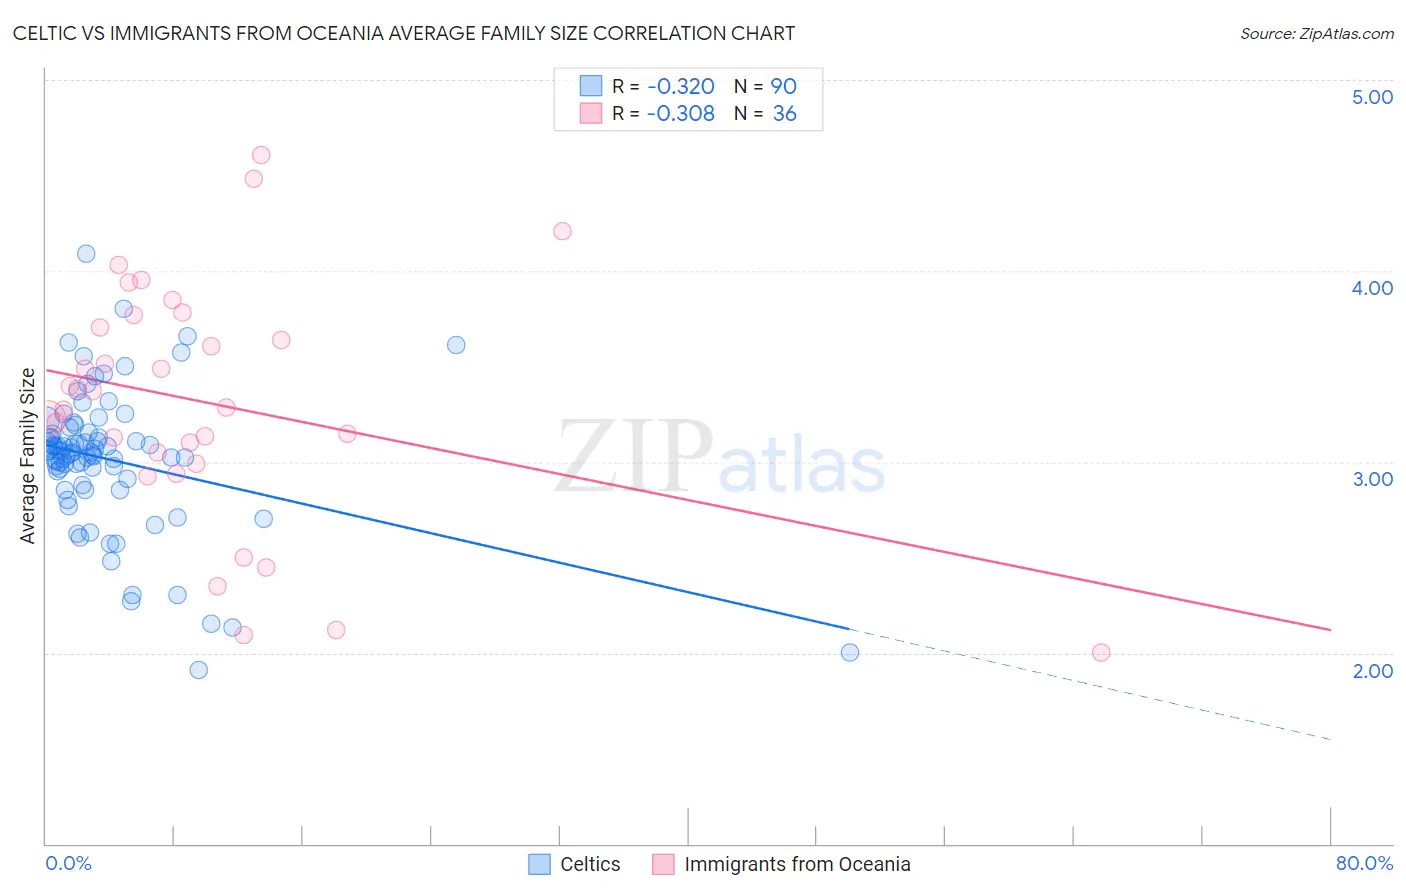
Celtic vs Immigrants from Oceania Average Family Size Correlation Chart
The statistical analysis conducted on geographies consisting of 168,846,519 people shows a mild negative correlation between the proportion of Celtics and average family size in the United States with a correlation coefficient (R) of -0.320 and weighted average of 3.11. Similarly, the statistical analysis conducted on geographies consisting of 305,389,085 people shows a mild negative correlation between the proportion of Immigrants from Oceania and average family size in the United States with a correlation coefficient (R) of -0.308 and weighted average of 3.29, a difference of 5.8%.
Average Family Size Correlation Summary
| Measurement | Celtic | Immigrants from Oceania |
| Minimum | 1.91 | 2.00 |
| Maximum | 4.09 | 4.61 |
| Range | 2.18 | 2.61 |
| Mean | 3.01 | 3.31 |
| Median | 3.05 | 3.33 |
| Interquartile 25% (IQ1) | 2.91 | 3.02 |
| Interquartile 75% (IQ3) | 3.15 | 3.74 |
| Interquartile Range (IQR) | 0.24 | 0.71 |
| Standard Deviation (Sample) | 0.37 | 0.63 |
| Standard Deviation (Population) | 0.37 | 0.62 |
Similar Demographics by Average Family Size
Demographics Similar to Celtics by Average Family Size
In terms of average family size, the demographic groups most similar to Celtics are English (3.11, a difference of 0.040%), Soviet Union (3.11, a difference of 0.080%), Ottawa (3.11, a difference of 0.090%), Dutch (3.11, a difference of 0.10%), and Czech (3.11, a difference of 0.10%).
| Demographics | Rating | Rank | Average Family Size |
| Italians | 0.1 /100 | #317 | Tragic 3.12 |
| Eastern Europeans | 0.1 /100 | #318 | Tragic 3.12 |
| Welsh | 0.1 /100 | #319 | Tragic 3.12 |
| Immigrants | North America | 0.0 /100 | #320 | Tragic 3.12 |
| Immigrants | Austria | 0.0 /100 | #321 | Tragic 3.12 |
| Immigrants | Canada | 0.0 /100 | #322 | Tragic 3.12 |
| Soviet Union | 0.0 /100 | #323 | Tragic 3.11 |
| Celtics | 0.0 /100 | #324 | Tragic 3.11 |
| English | 0.0 /100 | #325 | Tragic 3.11 |
| Ottawa | 0.0 /100 | #326 | Tragic 3.11 |
| Dutch | 0.0 /100 | #327 | Tragic 3.11 |
| Czechs | 0.0 /100 | #328 | Tragic 3.11 |
| Belgians | 0.0 /100 | #329 | Tragic 3.11 |
| Latvians | 0.0 /100 | #330 | Tragic 3.11 |
| Scotch-Irish | 0.0 /100 | #331 | Tragic 3.11 |
Demographics Similar to Immigrants from Oceania by Average Family Size
In terms of average family size, the demographic groups most similar to Immigrants from Oceania are Barbadian (3.29, a difference of 0.0%), Nigerian (3.29, a difference of 0.010%), Guamanian/Chamorro (3.29, a difference of 0.010%), Immigrants from Burma/Myanmar (3.29, a difference of 0.030%), and U.S. Virgin Islander (3.29, a difference of 0.040%).
| Demographics | Rating | Rank | Average Family Size |
| Menominee | 99.4 /100 | #90 | Exceptional 3.30 |
| Immigrants | Pakistan | 99.2 /100 | #91 | Exceptional 3.30 |
| Immigrants | Cameroon | 99.2 /100 | #92 | Exceptional 3.30 |
| Peruvians | 99.2 /100 | #93 | Exceptional 3.30 |
| Sierra Leoneans | 99.0 /100 | #94 | Exceptional 3.30 |
| Immigrants | Lebanon | 99.0 /100 | #95 | Exceptional 3.30 |
| U.S. Virgin Islanders | 98.8 /100 | #96 | Exceptional 3.29 |
| Immigrants | Oceania | 98.7 /100 | #97 | Exceptional 3.29 |
| Barbadians | 98.6 /100 | #98 | Exceptional 3.29 |
| Nigerians | 98.6 /100 | #99 | Exceptional 3.29 |
| Guamanians/Chamorros | 98.6 /100 | #100 | Exceptional 3.29 |
| Immigrants | Burma/Myanmar | 98.6 /100 | #101 | Exceptional 3.29 |
| West Indians | 98.5 /100 | #102 | Exceptional 3.29 |
| Immigrants | Western Africa | 98.4 /100 | #103 | Exceptional 3.29 |
| Bolivians | 98.3 /100 | #104 | Exceptional 3.29 |