Subsaharan African vs Austrian Nursery School
COMPARE
Subsaharan African
Austrian
Nursery School
Nursery School Comparison
Sub-Saharan Africans
Austrians
97.7%
NURSERY SCHOOL
3.2/ 100
METRIC RATING
227th/ 347
METRIC RANK
98.4%
NURSERY SCHOOL
99.8/ 100
METRIC RATING
57th/ 347
METRIC RANK
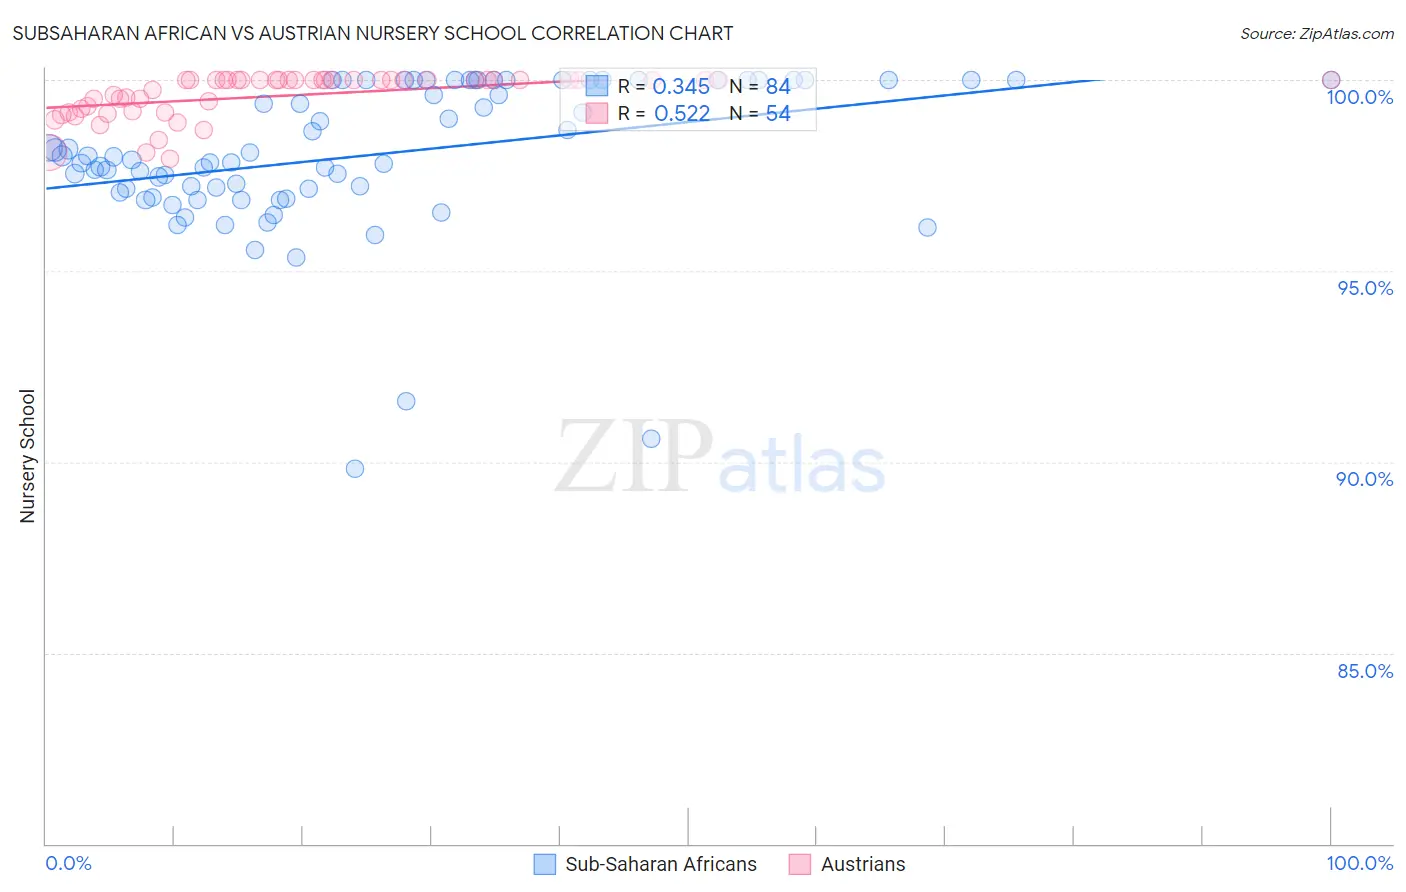
Subsaharan African vs Austrian Nursery School Correlation Chart
The statistical analysis conducted on geographies consisting of 508,209,936 people shows a mild positive correlation between the proportion of Sub-Saharan Africans and percentage of population with at least nursery school education in the United States with a correlation coefficient (R) of 0.345 and weighted average of 97.7%. Similarly, the statistical analysis conducted on geographies consisting of 452,080,536 people shows a substantial positive correlation between the proportion of Austrians and percentage of population with at least nursery school education in the United States with a correlation coefficient (R) of 0.522 and weighted average of 98.4%, a difference of 0.71%.
Nursery School Correlation Summary
| Measurement | Subsaharan African | Austrian |
| Minimum | 89.8% | 97.9% |
| Maximum | 100.0% | 100.0% |
| Range | 10.2% | 2.1% |
| Mean | 98.0% | 99.6% |
| Median | 97.9% | 100.0% |
| Interquartile 25% (IQ1) | 97.1% | 99.2% |
| Interquartile 75% (IQ3) | 100.0% | 100.0% |
| Interquartile Range (IQR) | 2.9% | 0.81% |
| Standard Deviation (Sample) | 2.0% | 0.58% |
| Standard Deviation (Population) | 2.0% | 0.57% |
Similar Demographics by Nursery School
Demographics Similar to Sub-Saharan Africans by Nursery School
In terms of nursery school, the demographic groups most similar to Sub-Saharan Africans are Sudanese (97.7%, a difference of 0.0%), Senegalese (97.7%, a difference of 0.0%), Immigrants from Nepal (97.7%, a difference of 0.010%), Immigrants from Costa Rica (97.7%, a difference of 0.010%), and Iraqi (97.7%, a difference of 0.010%).
| Demographics | Rating | Rank | Nursery School |
| Immigrants | Zaire | 4.4 /100 | #220 | Tragic 97.8% |
| Tongans | 4.3 /100 | #221 | Tragic 97.8% |
| Immigrants | Syria | 4.0 /100 | #222 | Tragic 97.7% |
| Immigrants | Sudan | 3.9 /100 | #223 | Tragic 97.7% |
| Immigrants | Nepal | 3.6 /100 | #224 | Tragic 97.7% |
| Immigrants | Costa Rica | 3.5 /100 | #225 | Tragic 97.7% |
| Iraqis | 3.5 /100 | #226 | Tragic 97.7% |
| Sub-Saharan Africans | 3.2 /100 | #227 | Tragic 97.7% |
| Sudanese | 3.2 /100 | #228 | Tragic 97.7% |
| Senegalese | 3.2 /100 | #229 | Tragic 97.7% |
| Sierra Leoneans | 2.9 /100 | #230 | Tragic 97.7% |
| Puerto Ricans | 2.6 /100 | #231 | Tragic 97.7% |
| Immigrants | Uruguay | 2.3 /100 | #232 | Tragic 97.7% |
| U.S. Virgin Islanders | 2.1 /100 | #233 | Tragic 97.7% |
| Colombians | 2.1 /100 | #234 | Tragic 97.7% |
Demographics Similar to Austrians by Nursery School
In terms of nursery school, the demographic groups most similar to Austrians are American (98.4%, a difference of 0.0%), Bulgarian (98.4%, a difference of 0.0%), Pueblo (98.4%, a difference of 0.010%), Immigrants from Scotland (98.4%, a difference of 0.010%), and Immigrants from Canada (98.4%, a difference of 0.010%).
| Demographics | Rating | Rank | Nursery School |
| Celtics | 99.8 /100 | #50 | Exceptional 98.5% |
| Estonians | 99.8 /100 | #51 | Exceptional 98.5% |
| Australians | 99.8 /100 | #52 | Exceptional 98.5% |
| Kiowa | 99.8 /100 | #53 | Exceptional 98.4% |
| Pueblo | 99.8 /100 | #54 | Exceptional 98.4% |
| Immigrants | Scotland | 99.8 /100 | #55 | Exceptional 98.4% |
| Americans | 99.8 /100 | #56 | Exceptional 98.4% |
| Austrians | 99.8 /100 | #57 | Exceptional 98.4% |
| Bulgarians | 99.8 /100 | #58 | Exceptional 98.4% |
| Immigrants | Canada | 99.8 /100 | #59 | Exceptional 98.4% |
| Slavs | 99.8 /100 | #60 | Exceptional 98.4% |
| New Zealanders | 99.7 /100 | #61 | Exceptional 98.4% |
| Creek | 99.7 /100 | #62 | Exceptional 98.4% |
| Immigrants | North America | 99.7 /100 | #63 | Exceptional 98.4% |
| Greeks | 99.7 /100 | #64 | Exceptional 98.4% |