Immigrants from Thailand vs Austrian Births to Unmarried Women
COMPARE
Immigrants from Thailand
Austrian
Births to Unmarried Women
Births to Unmarried Women Comparison
Immigrants from Thailand
Austrians
32.8%
BIRTHS TO UNMARRIED WOMEN
18.9/ 100
METRIC RATING
199th/ 347
METRIC RANK
31.0%
BIRTHS TO UNMARRIED WOMEN
69.9/ 100
METRIC RATING
158th/ 347
METRIC RANK
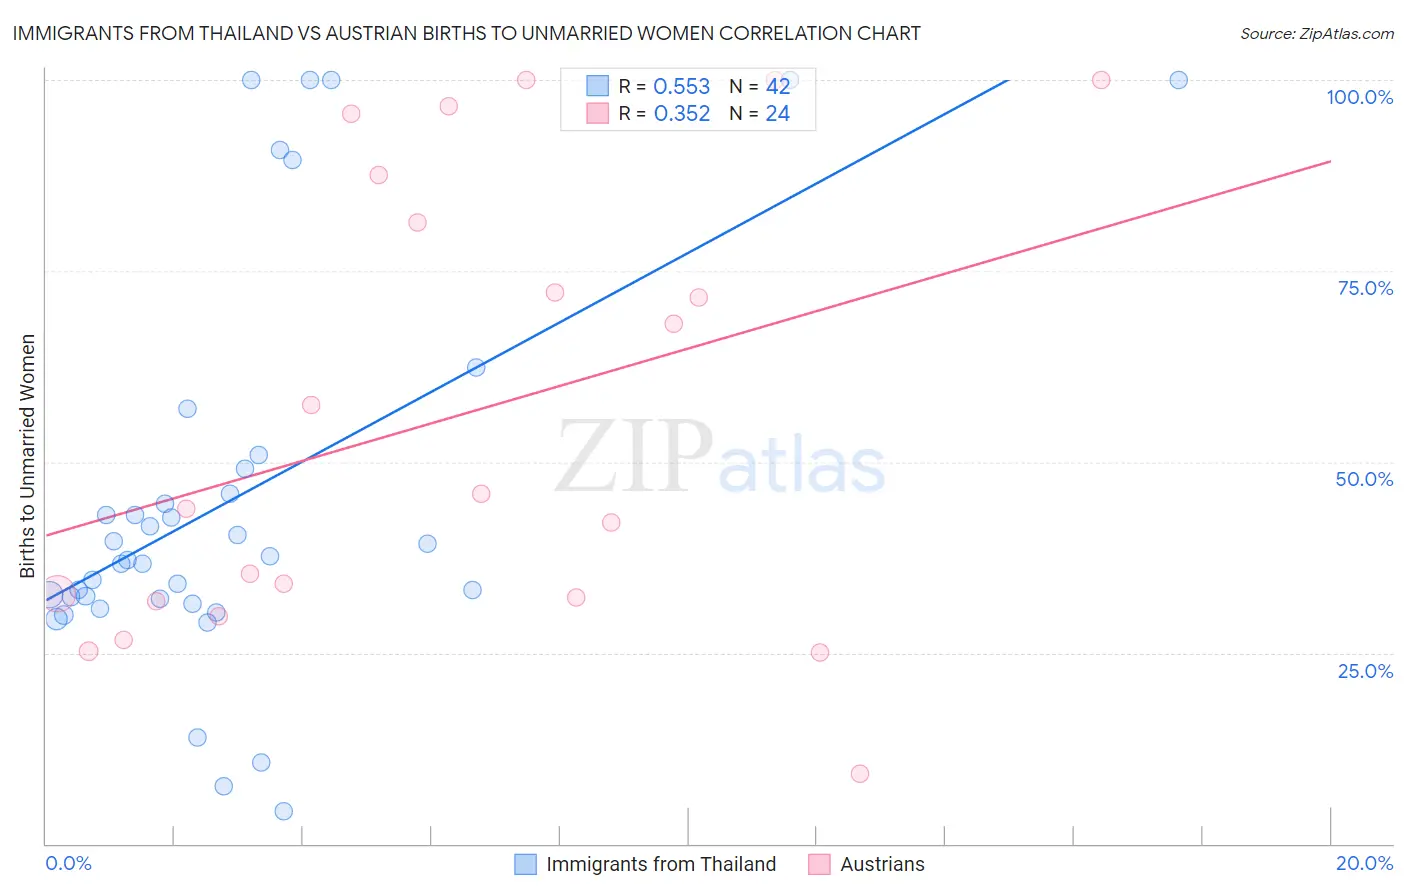
Immigrants from Thailand vs Austrian Births to Unmarried Women Correlation Chart
The statistical analysis conducted on geographies consisting of 301,314,253 people shows a substantial positive correlation between the proportion of Immigrants from Thailand and percentage of births to unmarried women in the United States with a correlation coefficient (R) of 0.553 and weighted average of 32.8%. Similarly, the statistical analysis conducted on geographies consisting of 412,149,174 people shows a mild positive correlation between the proportion of Austrians and percentage of births to unmarried women in the United States with a correlation coefficient (R) of 0.352 and weighted average of 31.0%, a difference of 5.5%.
Births to Unmarried Women Correlation Summary
| Measurement | Immigrants from Thailand | Austrian |
| Minimum | 4.3% | 9.1% |
| Maximum | 100.0% | 100.0% |
| Range | 95.7% | 90.9% |
| Mean | 45.5% | 56.0% |
| Median | 37.5% | 44.8% |
| Interquartile 25% (IQ1) | 32.2% | 32.1% |
| Interquartile 75% (IQ3) | 49.1% | 84.4% |
| Interquartile Range (IQR) | 17.0% | 52.4% |
| Standard Deviation (Sample) | 26.0% | 29.5% |
| Standard Deviation (Population) | 25.7% | 28.9% |
Similar Demographics by Births to Unmarried Women
Demographics Similar to Immigrants from Thailand by Births to Unmarried Women
In terms of births to unmarried women, the demographic groups most similar to Immigrants from Thailand are Immigrants from Germany (32.8%, a difference of 0.010%), Costa Rican (32.7%, a difference of 0.20%), Immigrants (32.7%, a difference of 0.25%), Immigrants from Burma/Myanmar (32.9%, a difference of 0.34%), and Immigrants from Micronesia (32.9%, a difference of 0.35%).
| Demographics | Rating | Rank | Births to Unmarried Women |
| Colombians | 31.9 /100 | #192 | Fair 32.2% |
| Fijians | 31.1 /100 | #193 | Fair 32.3% |
| Sudanese | 27.3 /100 | #194 | Fair 32.4% |
| Samoans | 21.9 /100 | #195 | Fair 32.6% |
| Immigrants | Colombia | 21.7 /100 | #196 | Fair 32.6% |
| Immigrants | Immigrants | 20.6 /100 | #197 | Fair 32.7% |
| Costa Ricans | 20.3 /100 | #198 | Fair 32.7% |
| Immigrants | Thailand | 18.9 /100 | #199 | Poor 32.8% |
| Immigrants | Germany | 18.8 /100 | #200 | Poor 32.8% |
| Immigrants | Burma/Myanmar | 16.7 /100 | #201 | Poor 32.9% |
| Immigrants | Micronesia | 16.6 /100 | #202 | Poor 32.9% |
| Ute | 14.4 /100 | #203 | Poor 33.0% |
| Immigrants | Africa | 14.3 /100 | #204 | Poor 33.0% |
| German Russians | 13.1 /100 | #205 | Poor 33.1% |
| Uruguayans | 12.8 /100 | #206 | Poor 33.1% |
Demographics Similar to Austrians by Births to Unmarried Women
In terms of births to unmarried women, the demographic groups most similar to Austrians are Immigrants from England (31.1%, a difference of 0.060%), Immigrants from Western Europe (31.1%, a difference of 0.060%), Immigrants from Southern Europe (31.1%, a difference of 0.13%), Immigrants from Eastern Africa (31.0%, a difference of 0.27%), and Carpatho Rusyn (30.9%, a difference of 0.44%).
| Demographics | Rating | Rank | Births to Unmarried Women |
| Italians | 77.0 /100 | #151 | Good 30.8% |
| Poles | 76.2 /100 | #152 | Good 30.8% |
| British | 76.0 /100 | #153 | Good 30.8% |
| Yugoslavians | 75.1 /100 | #154 | Good 30.8% |
| Immigrants | Bangladesh | 73.9 /100 | #155 | Good 30.9% |
| Carpatho Rusyns | 73.5 /100 | #156 | Good 30.9% |
| Immigrants | Eastern Africa | 72.1 /100 | #157 | Good 31.0% |
| Austrians | 69.9 /100 | #158 | Good 31.0% |
| Immigrants | England | 69.4 /100 | #159 | Good 31.1% |
| Immigrants | Western Europe | 69.3 /100 | #160 | Good 31.1% |
| Immigrants | Southern Europe | 68.7 /100 | #161 | Good 31.1% |
| Slovenes | 65.9 /100 | #162 | Good 31.2% |
| Immigrants | Chile | 65.7 /100 | #163 | Good 31.2% |
| Hungarians | 64.1 /100 | #164 | Good 31.2% |
| Immigrants | Somalia | 58.1 /100 | #165 | Average 31.4% |