Spanish vs French Married-couple Households
COMPARE
Spanish
French
Married-couple Households
Married-couple Households Comparison
Spanish
French
47.2%
MARRIED-COUPLE HOUSEHOLDS
84.5/ 100
METRIC RATING
140th/ 347
METRIC RANK
48.0%
MARRIED-COUPLE HOUSEHOLDS
97.2/ 100
METRIC RATING
90th/ 347
METRIC RANK
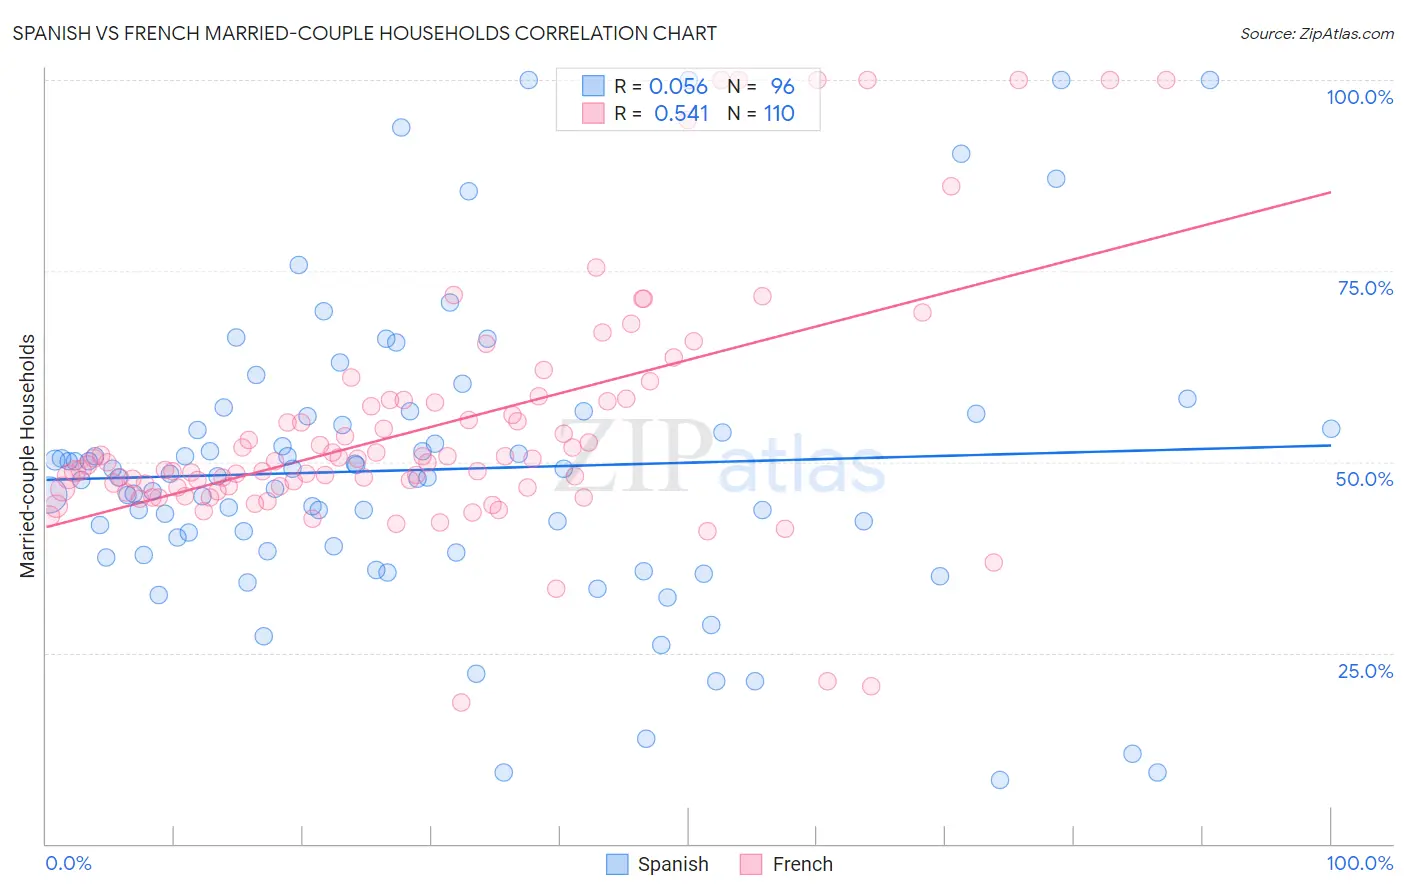
Spanish vs French Married-couple Households Correlation Chart
The statistical analysis conducted on geographies consisting of 421,907,017 people shows a slight positive correlation between the proportion of Spanish and percentage of married-couple family households in the United States with a correlation coefficient (R) of 0.056 and weighted average of 47.2%. Similarly, the statistical analysis conducted on geographies consisting of 571,775,805 people shows a substantial positive correlation between the proportion of French and percentage of married-couple family households in the United States with a correlation coefficient (R) of 0.541 and weighted average of 48.0%, a difference of 1.7%.
Married-couple Households Correlation Summary
| Measurement | Spanish | French |
| Minimum | 8.3% | 18.5% |
| Maximum | 100.0% | 100.0% |
| Range | 91.7% | 81.5% |
| Mean | 49.0% | 54.4% |
| Median | 48.0% | 49.9% |
| Interquartile 25% (IQ1) | 38.6% | 46.7% |
| Interquartile 75% (IQ3) | 55.4% | 57.9% |
| Interquartile Range (IQR) | 16.8% | 11.2% |
| Standard Deviation (Sample) | 19.2% | 16.0% |
| Standard Deviation (Population) | 19.1% | 15.9% |
Similar Demographics by Married-couple Households
Demographics Similar to Spanish by Married-couple Households
In terms of married-couple households, the demographic groups most similar to Spanish are Costa Rican (47.2%, a difference of 0.0%), Immigrants from Sweden (47.2%, a difference of 0.020%), Spaniard (47.2%, a difference of 0.020%), Immigrants from Afghanistan (47.2%, a difference of 0.050%), and Immigrants from Belarus (47.2%, a difference of 0.050%).
| Demographics | Rating | Rank | Married-couple Households |
| South Africans | 86.4 /100 | #133 | Excellent 47.3% |
| Immigrants | Greece | 86.0 /100 | #134 | Excellent 47.2% |
| Immigrants | Argentina | 86.0 /100 | #135 | Excellent 47.2% |
| New Zealanders | 85.3 /100 | #136 | Excellent 47.2% |
| Immigrants | Malaysia | 85.2 /100 | #137 | Excellent 47.2% |
| Immigrants | Afghanistan | 85.1 /100 | #138 | Excellent 47.2% |
| Immigrants | Sweden | 84.7 /100 | #139 | Excellent 47.2% |
| Spanish | 84.5 /100 | #140 | Excellent 47.2% |
| Costa Ricans | 84.4 /100 | #141 | Excellent 47.2% |
| Spaniards | 84.1 /100 | #142 | Excellent 47.2% |
| Immigrants | Belarus | 83.8 /100 | #143 | Excellent 47.2% |
| Mexicans | 83.4 /100 | #144 | Excellent 47.1% |
| Slovenes | 81.7 /100 | #145 | Excellent 47.1% |
| Immigrants | Western Europe | 81.6 /100 | #146 | Excellent 47.1% |
| Immigrants | Syria | 81.6 /100 | #147 | Excellent 47.1% |
Demographics Similar to French by Married-couple Households
In terms of married-couple households, the demographic groups most similar to French are Cypriot (48.0%, a difference of 0.010%), Afghan (48.0%, a difference of 0.040%), Immigrants from Ireland (48.0%, a difference of 0.050%), Belgian (48.0%, a difference of 0.060%), and Immigrants from Moldova (48.0%, a difference of 0.060%).
| Demographics | Rating | Rank | Married-couple Households |
| Guamanians/Chamorros | 97.6 /100 | #83 | Exceptional 48.1% |
| Ukrainians | 97.6 /100 | #84 | Exceptional 48.1% |
| Immigrants | Israel | 97.4 /100 | #85 | Exceptional 48.0% |
| Belgians | 97.4 /100 | #86 | Exceptional 48.0% |
| Immigrants | Ireland | 97.3 /100 | #87 | Exceptional 48.0% |
| Afghans | 97.3 /100 | #88 | Exceptional 48.0% |
| Cypriots | 97.2 /100 | #89 | Exceptional 48.0% |
| French | 97.2 /100 | #90 | Exceptional 48.0% |
| Immigrants | Moldova | 97.0 /100 | #91 | Exceptional 48.0% |
| Palestinians | 96.9 /100 | #92 | Exceptional 48.0% |
| Lebanese | 96.9 /100 | #93 | Exceptional 47.9% |
| Americans | 96.9 /100 | #94 | Exceptional 47.9% |
| Immigrants | Belgium | 96.8 /100 | #95 | Exceptional 47.9% |
| Immigrants | Egypt | 96.6 /100 | #96 | Exceptional 47.9% |
| Latvians | 96.5 /100 | #97 | Exceptional 47.9% |