Spanish vs Immigrants from Mexico Divorced or Separated
COMPARE
Spanish
Immigrants from Mexico
Divorced or Separated
Divorced or Separated Comparison
Spanish
Immigrants from Mexico
12.8%
DIVORCED OR SEPARATED
0.1/ 100
METRIC RATING
286th/ 347
METRIC RANK
12.0%
DIVORCED OR SEPARATED
53.2/ 100
METRIC RATING
172nd/ 347
METRIC RANK
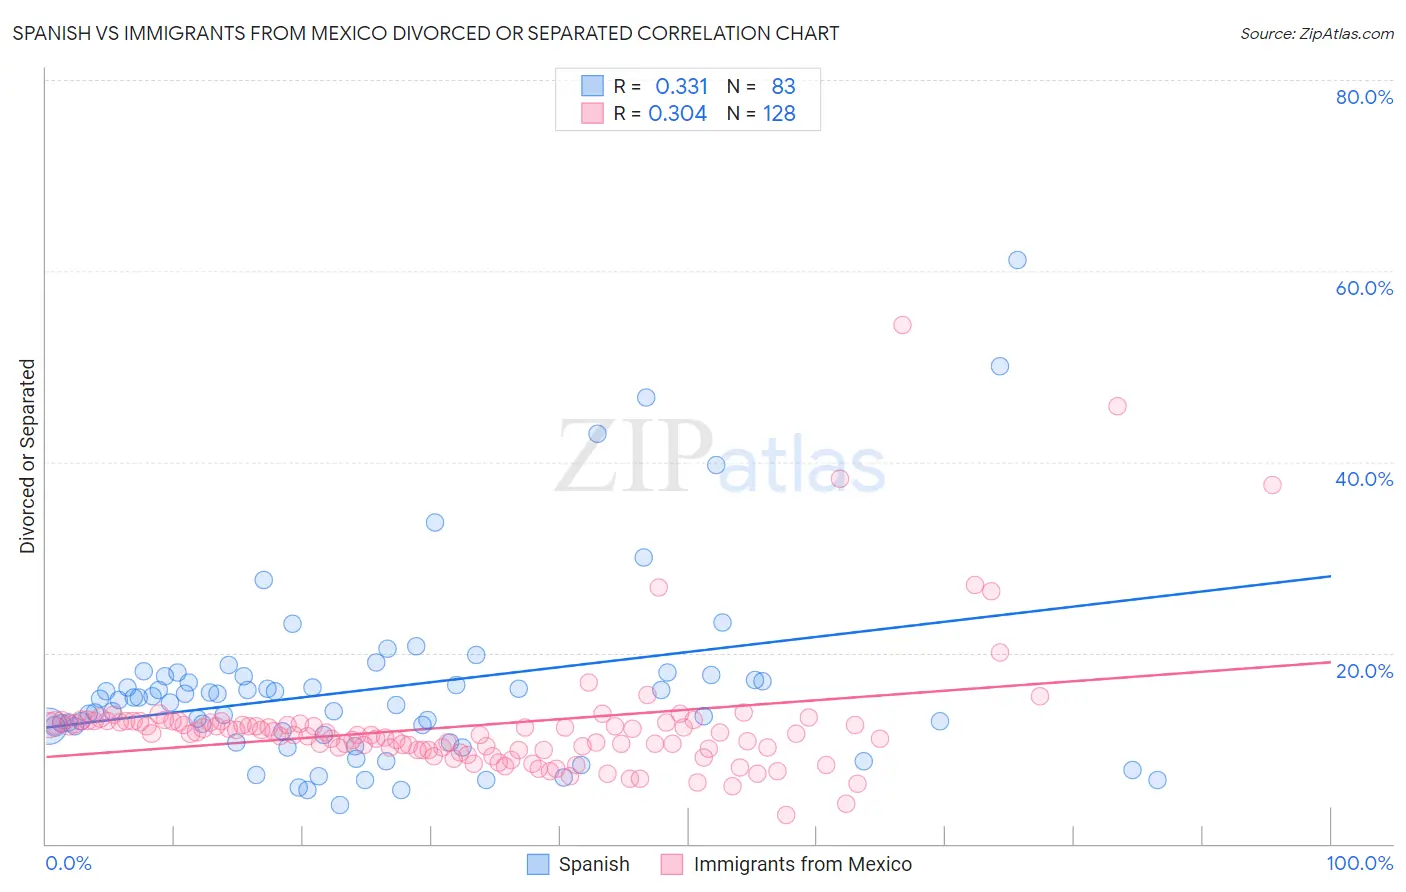
Spanish vs Immigrants from Mexico Divorced or Separated Correlation Chart
The statistical analysis conducted on geographies consisting of 422,013,877 people shows a mild positive correlation between the proportion of Spanish and percentage of population currently divorced or separated in the United States with a correlation coefficient (R) of 0.331 and weighted average of 12.8%. Similarly, the statistical analysis conducted on geographies consisting of 513,547,698 people shows a mild positive correlation between the proportion of Immigrants from Mexico and percentage of population currently divorced or separated in the United States with a correlation coefficient (R) of 0.304 and weighted average of 12.0%, a difference of 6.2%.
Divorced or Separated Correlation Summary
| Measurement | Spanish | Immigrants from Mexico |
| Minimum | 4.0% | 3.0% |
| Maximum | 61.2% | 54.4% |
| Range | 57.2% | 51.4% |
| Mean | 16.3% | 12.4% |
| Median | 15.1% | 11.5% |
| Interquartile 25% (IQ1) | 11.4% | 9.9% |
| Interquartile 75% (IQ3) | 17.6% | 12.7% |
| Interquartile Range (IQR) | 6.1% | 2.8% |
| Standard Deviation (Sample) | 9.8% | 6.7% |
| Standard Deviation (Population) | 9.7% | 6.7% |
Similar Demographics by Divorced or Separated
Demographics Similar to Spanish by Divorced or Separated
In terms of divorced or separated, the demographic groups most similar to Spanish are Honduran (12.8%, a difference of 0.19%), French (12.8%, a difference of 0.23%), Nonimmigrants (12.8%, a difference of 0.26%), Delaware (12.7%, a difference of 0.35%), and Subsaharan African (12.7%, a difference of 0.36%).
| Demographics | Rating | Rank | Divorced or Separated |
| Immigrants | Dominican Republic | 0.2 /100 | #279 | Tragic 12.7% |
| Immigrants | Zaire | 0.2 /100 | #280 | Tragic 12.7% |
| Pueblo | 0.2 /100 | #281 | Tragic 12.7% |
| Sub-Saharan Africans | 0.1 /100 | #282 | Tragic 12.7% |
| Delaware | 0.1 /100 | #283 | Tragic 12.7% |
| Immigrants | Nonimmigrants | 0.1 /100 | #284 | Tragic 12.8% |
| French | 0.1 /100 | #285 | Tragic 12.8% |
| Spanish | 0.1 /100 | #286 | Tragic 12.8% |
| Hondurans | 0.1 /100 | #287 | Tragic 12.8% |
| French Canadians | 0.1 /100 | #288 | Tragic 12.8% |
| Iroquois | 0.0 /100 | #289 | Tragic 12.9% |
| Pima | 0.0 /100 | #290 | Tragic 12.9% |
| Immigrants | Honduras | 0.0 /100 | #291 | Tragic 12.9% |
| Scotch-Irish | 0.0 /100 | #292 | Tragic 12.9% |
| Jamaicans | 0.0 /100 | #293 | Tragic 12.9% |
Demographics Similar to Immigrants from Mexico by Divorced or Separated
In terms of divorced or separated, the demographic groups most similar to Immigrants from Mexico are Costa Rican (12.0%, a difference of 0.010%), Mexican American Indian (12.0%, a difference of 0.090%), Immigrants from Moldova (12.1%, a difference of 0.090%), Hawaiian (12.1%, a difference of 0.11%), and Immigrants from Sierra Leone (12.1%, a difference of 0.11%).
| Demographics | Rating | Rank | Divorced or Separated |
| German Russians | 61.8 /100 | #165 | Good 12.0% |
| Tohono O'odham | 60.4 /100 | #166 | Good 12.0% |
| Ethiopians | 58.5 /100 | #167 | Average 12.0% |
| Serbians | 57.1 /100 | #168 | Average 12.0% |
| Immigrants | Peru | 57.0 /100 | #169 | Average 12.0% |
| Mexican American Indians | 55.8 /100 | #170 | Average 12.0% |
| Costa Ricans | 53.3 /100 | #171 | Average 12.0% |
| Immigrants | Mexico | 53.2 /100 | #172 | Average 12.0% |
| Immigrants | Moldova | 50.4 /100 | #173 | Average 12.1% |
| Hawaiians | 50.0 /100 | #174 | Average 12.1% |
| Immigrants | Sierra Leone | 50.0 /100 | #175 | Average 12.1% |
| Pennsylvania Germans | 48.9 /100 | #176 | Average 12.1% |
| Brazilians | 47.7 /100 | #177 | Average 12.1% |
| Ghanaians | 45.9 /100 | #178 | Average 12.1% |
| Immigrants | Western Europe | 45.6 /100 | #179 | Average 12.1% |