Creek vs Immigrants from Mexico Divorced or Separated
COMPARE
Creek
Immigrants from Mexico
Divorced or Separated
Divorced or Separated Comparison
Creek
Immigrants from Mexico
14.4%
DIVORCED OR SEPARATED
0.0/ 100
METRIC RATING
343rd/ 347
METRIC RANK
12.0%
DIVORCED OR SEPARATED
53.2/ 100
METRIC RATING
172nd/ 347
METRIC RANK
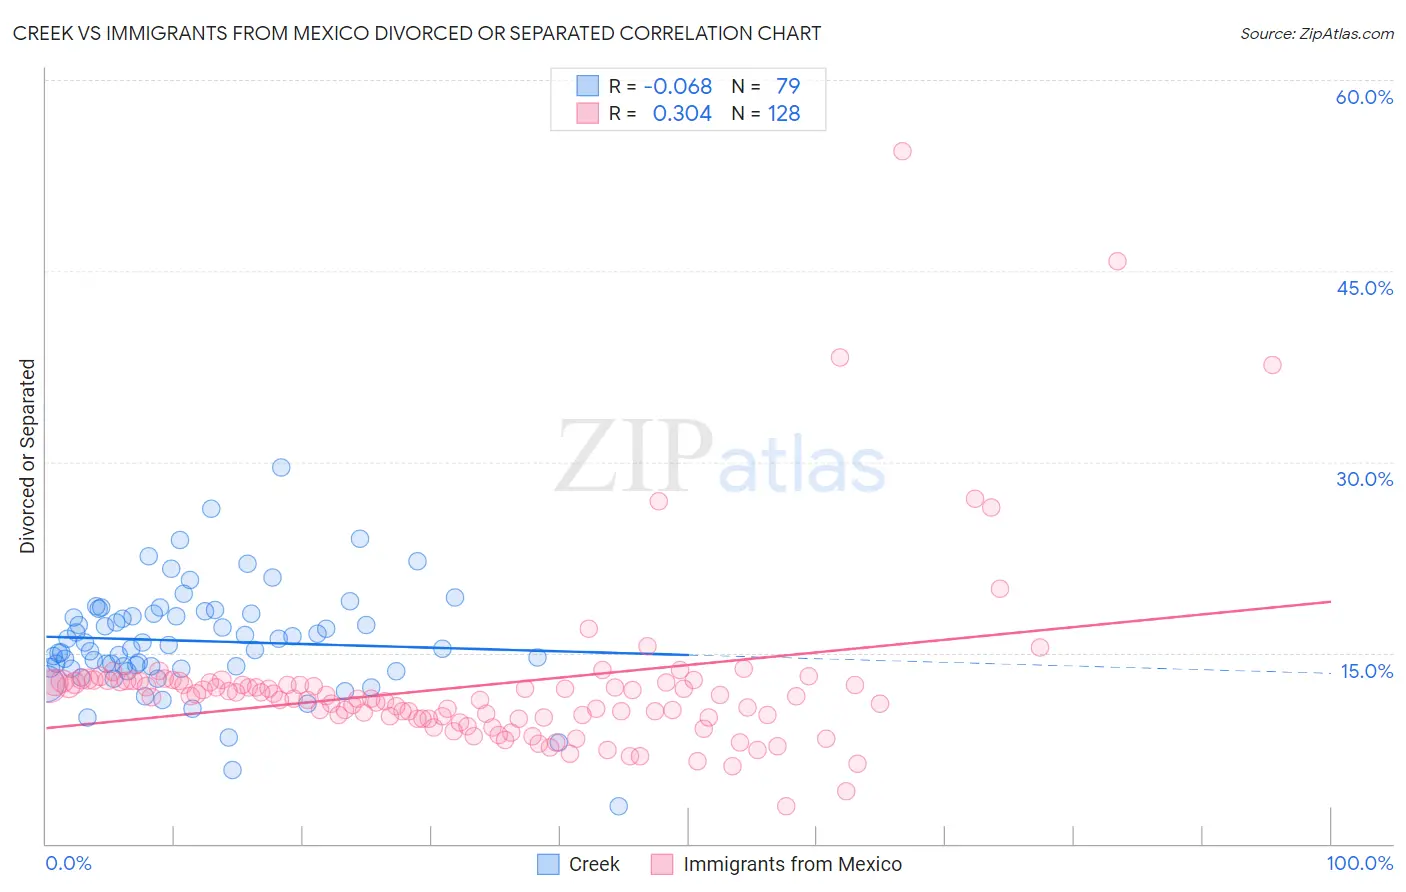
Creek vs Immigrants from Mexico Divorced or Separated Correlation Chart
The statistical analysis conducted on geographies consisting of 178,467,072 people shows a slight negative correlation between the proportion of Creek and percentage of population currently divorced or separated in the United States with a correlation coefficient (R) of -0.068 and weighted average of 14.4%. Similarly, the statistical analysis conducted on geographies consisting of 513,547,698 people shows a mild positive correlation between the proportion of Immigrants from Mexico and percentage of population currently divorced or separated in the United States with a correlation coefficient (R) of 0.304 and weighted average of 12.0%, a difference of 19.6%.
Divorced or Separated Correlation Summary
| Measurement | Creek | Immigrants from Mexico |
| Minimum | 2.9% | 3.0% |
| Maximum | 29.6% | 54.4% |
| Range | 26.7% | 51.4% |
| Mean | 15.9% | 12.4% |
| Median | 15.6% | 11.5% |
| Interquartile 25% (IQ1) | 13.8% | 9.9% |
| Interquartile 75% (IQ3) | 18.1% | 12.7% |
| Interquartile Range (IQR) | 4.3% | 2.8% |
| Standard Deviation (Sample) | 4.2% | 6.7% |
| Standard Deviation (Population) | 4.2% | 6.7% |
Similar Demographics by Divorced or Separated
Demographics Similar to Creek by Divorced or Separated
In terms of divorced or separated, the demographic groups most similar to Creek are Cuban (14.5%, a difference of 0.68%), Kiowa (14.5%, a difference of 0.77%), Seminole (14.3%, a difference of 1.1%), Bahamian (14.2%, a difference of 1.2%), and Chickasaw (14.2%, a difference of 1.4%).
| Demographics | Rating | Rank | Divorced or Separated |
| Puerto Ricans | 0.0 /100 | #333 | Tragic 13.9% |
| Immigrants | Bahamas | 0.0 /100 | #334 | Tragic 13.9% |
| Dutch West Indians | 0.0 /100 | #335 | Tragic 14.0% |
| Shoshone | 0.0 /100 | #336 | Tragic 14.0% |
| Crow | 0.0 /100 | #337 | Tragic 14.1% |
| Choctaw | 0.0 /100 | #338 | Tragic 14.1% |
| Colville | 0.0 /100 | #339 | Tragic 14.2% |
| Chickasaw | 0.0 /100 | #340 | Tragic 14.2% |
| Bahamians | 0.0 /100 | #341 | Tragic 14.2% |
| Seminole | 0.0 /100 | #342 | Tragic 14.3% |
| Creek | 0.0 /100 | #343 | Tragic 14.4% |
| Cubans | 0.0 /100 | #344 | Tragic 14.5% |
| Kiowa | 0.0 /100 | #345 | Tragic 14.5% |
| Arapaho | 0.0 /100 | #346 | Tragic 14.8% |
| Immigrants | Cuba | 0.0 /100 | #347 | Tragic 15.2% |
Demographics Similar to Immigrants from Mexico by Divorced or Separated
In terms of divorced or separated, the demographic groups most similar to Immigrants from Mexico are Costa Rican (12.0%, a difference of 0.010%), Mexican American Indian (12.0%, a difference of 0.090%), Immigrants from Moldova (12.1%, a difference of 0.090%), Hawaiian (12.1%, a difference of 0.11%), and Immigrants from Sierra Leone (12.1%, a difference of 0.11%).
| Demographics | Rating | Rank | Divorced or Separated |
| German Russians | 61.8 /100 | #165 | Good 12.0% |
| Tohono O'odham | 60.4 /100 | #166 | Good 12.0% |
| Ethiopians | 58.5 /100 | #167 | Average 12.0% |
| Serbians | 57.1 /100 | #168 | Average 12.0% |
| Immigrants | Peru | 57.0 /100 | #169 | Average 12.0% |
| Mexican American Indians | 55.8 /100 | #170 | Average 12.0% |
| Costa Ricans | 53.3 /100 | #171 | Average 12.0% |
| Immigrants | Mexico | 53.2 /100 | #172 | Average 12.0% |
| Immigrants | Moldova | 50.4 /100 | #173 | Average 12.1% |
| Hawaiians | 50.0 /100 | #174 | Average 12.1% |
| Immigrants | Sierra Leone | 50.0 /100 | #175 | Average 12.1% |
| Pennsylvania Germans | 48.9 /100 | #176 | Average 12.1% |
| Brazilians | 47.7 /100 | #177 | Average 12.1% |
| Ghanaians | 45.9 /100 | #178 | Average 12.1% |
| Immigrants | Western Europe | 45.6 /100 | #179 | Average 12.1% |