Spanish vs Swedish Divorced or Separated
COMPARE
Spanish
Swedish
Divorced or Separated
Divorced or Separated Comparison
Spanish
Swedes
12.8%
DIVORCED OR SEPARATED
0.1/ 100
METRIC RATING
286th/ 347
METRIC RANK
12.1%
DIVORCED OR SEPARATED
34.4/ 100
METRIC RATING
191st/ 347
METRIC RANK
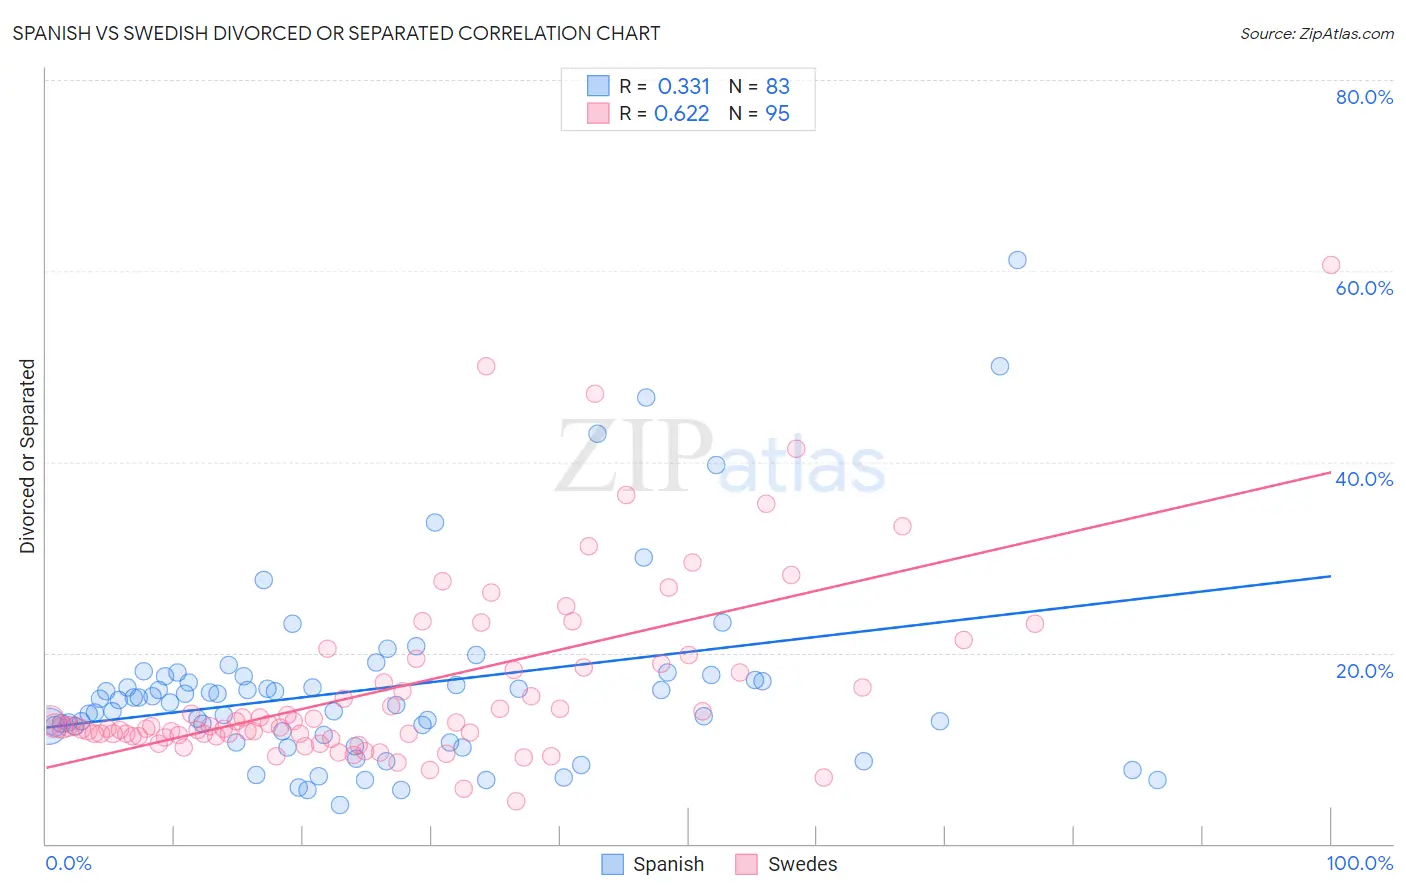
Spanish vs Swedish Divorced or Separated Correlation Chart
The statistical analysis conducted on geographies consisting of 422,013,877 people shows a mild positive correlation between the proportion of Spanish and percentage of population currently divorced or separated in the United States with a correlation coefficient (R) of 0.331 and weighted average of 12.8%. Similarly, the statistical analysis conducted on geographies consisting of 538,888,854 people shows a significant positive correlation between the proportion of Swedes and percentage of population currently divorced or separated in the United States with a correlation coefficient (R) of 0.622 and weighted average of 12.1%, a difference of 5.5%.
Divorced or Separated Correlation Summary
| Measurement | Spanish | Swedish |
| Minimum | 4.0% | 4.5% |
| Maximum | 61.2% | 60.6% |
| Range | 57.2% | 56.1% |
| Mean | 16.3% | 16.3% |
| Median | 15.1% | 12.3% |
| Interquartile 25% (IQ1) | 11.4% | 11.4% |
| Interquartile 75% (IQ3) | 17.6% | 18.5% |
| Interquartile Range (IQR) | 6.1% | 7.2% |
| Standard Deviation (Sample) | 9.8% | 9.7% |
| Standard Deviation (Population) | 9.7% | 9.6% |
Similar Demographics by Divorced or Separated
Demographics Similar to Spanish by Divorced or Separated
In terms of divorced or separated, the demographic groups most similar to Spanish are Honduran (12.8%, a difference of 0.19%), French (12.8%, a difference of 0.23%), Nonimmigrants (12.8%, a difference of 0.26%), Delaware (12.7%, a difference of 0.35%), and Subsaharan African (12.7%, a difference of 0.36%).
| Demographics | Rating | Rank | Divorced or Separated |
| Immigrants | Dominican Republic | 0.2 /100 | #279 | Tragic 12.7% |
| Immigrants | Zaire | 0.2 /100 | #280 | Tragic 12.7% |
| Pueblo | 0.2 /100 | #281 | Tragic 12.7% |
| Sub-Saharan Africans | 0.1 /100 | #282 | Tragic 12.7% |
| Delaware | 0.1 /100 | #283 | Tragic 12.7% |
| Immigrants | Nonimmigrants | 0.1 /100 | #284 | Tragic 12.8% |
| French | 0.1 /100 | #285 | Tragic 12.8% |
| Spanish | 0.1 /100 | #286 | Tragic 12.8% |
| Hondurans | 0.1 /100 | #287 | Tragic 12.8% |
| French Canadians | 0.1 /100 | #288 | Tragic 12.8% |
| Iroquois | 0.0 /100 | #289 | Tragic 12.9% |
| Pima | 0.0 /100 | #290 | Tragic 12.9% |
| Immigrants | Honduras | 0.0 /100 | #291 | Tragic 12.9% |
| Scotch-Irish | 0.0 /100 | #292 | Tragic 12.9% |
| Jamaicans | 0.0 /100 | #293 | Tragic 12.9% |
Demographics Similar to Swedes by Divorced or Separated
In terms of divorced or separated, the demographic groups most similar to Swedes are Moroccan (12.1%, a difference of 0.020%), Sierra Leonean (12.1%, a difference of 0.040%), Norwegian (12.1%, a difference of 0.050%), Immigrants from Thailand (12.1%, a difference of 0.070%), and Immigrants from Eritrea (12.1%, a difference of 0.10%).
| Demographics | Rating | Rank | Divorced or Separated |
| Immigrants | North America | 41.1 /100 | #184 | Average 12.1% |
| Immigrants | Nigeria | 40.5 /100 | #185 | Average 12.1% |
| Immigrants | Chile | 39.0 /100 | #186 | Fair 12.1% |
| Belizeans | 37.7 /100 | #187 | Fair 12.1% |
| Immigrants | Belize | 37.6 /100 | #188 | Fair 12.1% |
| Sierra Leoneans | 35.5 /100 | #189 | Fair 12.1% |
| Moroccans | 34.8 /100 | #190 | Fair 12.1% |
| Swedes | 34.4 /100 | #191 | Fair 12.1% |
| Norwegians | 33.2 /100 | #192 | Fair 12.1% |
| Immigrants | Thailand | 32.5 /100 | #193 | Fair 12.1% |
| Immigrants | Eritrea | 31.9 /100 | #194 | Fair 12.1% |
| Immigrants | England | 31.4 /100 | #195 | Fair 12.1% |
| Immigrants | Burma/Myanmar | 30.4 /100 | #196 | Fair 12.1% |
| Immigrants | Africa | 30.3 /100 | #197 | Fair 12.1% |
| Nigerians | 30.1 /100 | #198 | Fair 12.1% |