Spanish vs Vietnamese Divorced or Separated
COMPARE
Spanish
Vietnamese
Divorced or Separated
Divorced or Separated Comparison
Spanish
Vietnamese
12.8%
DIVORCED OR SEPARATED
0.1/ 100
METRIC RATING
286th/ 347
METRIC RANK
10.8%
DIVORCED OR SEPARATED
100.0/ 100
METRIC RATING
22nd/ 347
METRIC RANK
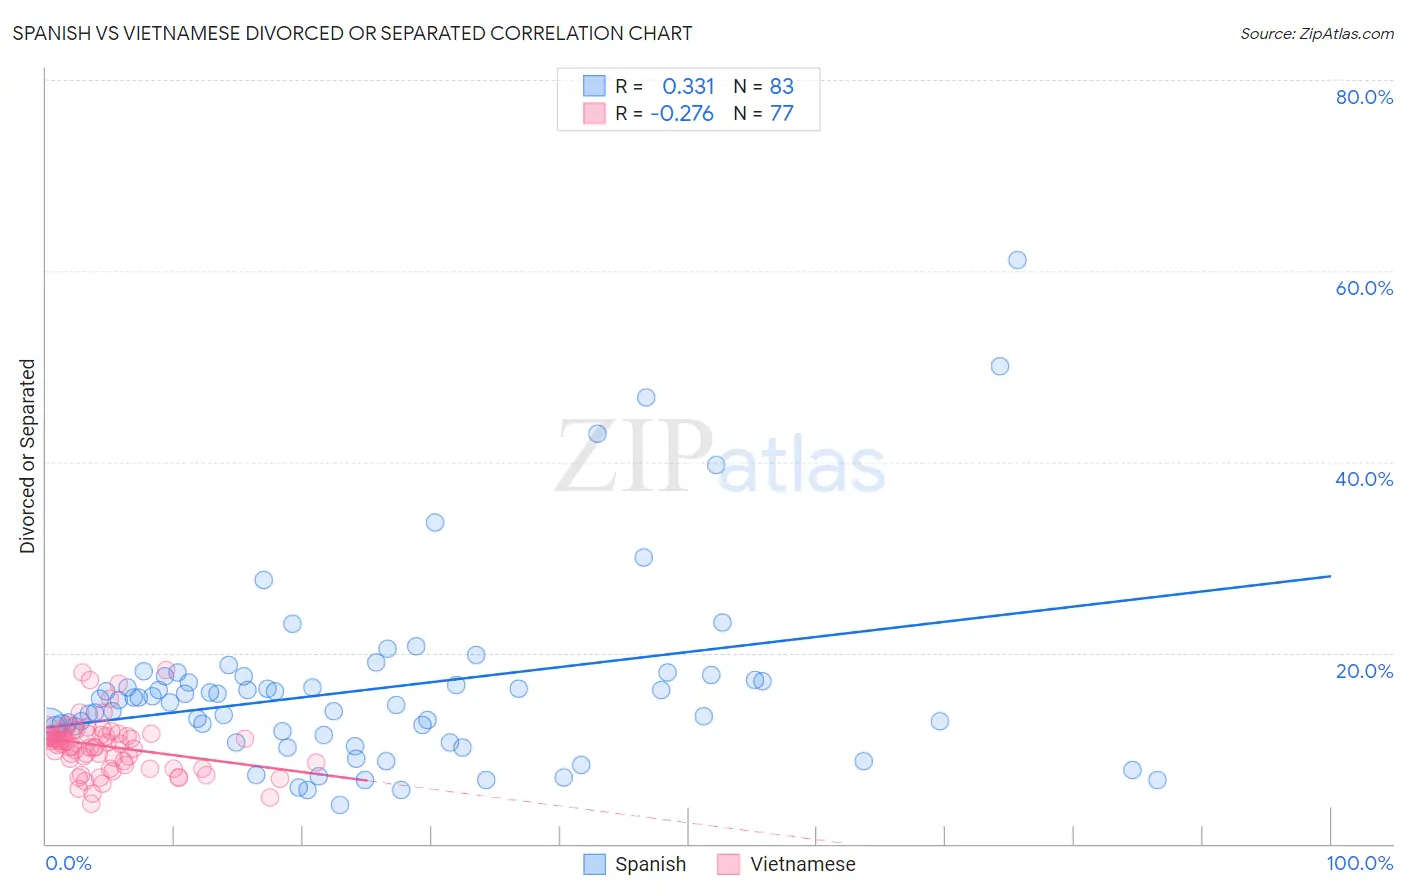
Spanish vs Vietnamese Divorced or Separated Correlation Chart
The statistical analysis conducted on geographies consisting of 422,013,877 people shows a mild positive correlation between the proportion of Spanish and percentage of population currently divorced or separated in the United States with a correlation coefficient (R) of 0.331 and weighted average of 12.8%. Similarly, the statistical analysis conducted on geographies consisting of 170,663,276 people shows a weak negative correlation between the proportion of Vietnamese and percentage of population currently divorced or separated in the United States with a correlation coefficient (R) of -0.276 and weighted average of 10.8%, a difference of 18.8%.
Divorced or Separated Correlation Summary
| Measurement | Spanish | Vietnamese |
| Minimum | 4.0% | 4.2% |
| Maximum | 61.2% | 18.2% |
| Range | 57.2% | 14.0% |
| Mean | 16.3% | 10.2% |
| Median | 15.1% | 10.5% |
| Interquartile 25% (IQ1) | 11.4% | 8.3% |
| Interquartile 75% (IQ3) | 17.6% | 11.5% |
| Interquartile Range (IQR) | 6.1% | 3.1% |
| Standard Deviation (Sample) | 9.8% | 2.7% |
| Standard Deviation (Population) | 9.7% | 2.7% |
Similar Demographics by Divorced or Separated
Demographics Similar to Spanish by Divorced or Separated
In terms of divorced or separated, the demographic groups most similar to Spanish are Honduran (12.8%, a difference of 0.19%), French (12.8%, a difference of 0.23%), Nonimmigrants (12.8%, a difference of 0.26%), Delaware (12.7%, a difference of 0.35%), and Subsaharan African (12.7%, a difference of 0.36%).
| Demographics | Rating | Rank | Divorced or Separated |
| Immigrants | Dominican Republic | 0.2 /100 | #279 | Tragic 12.7% |
| Immigrants | Zaire | 0.2 /100 | #280 | Tragic 12.7% |
| Pueblo | 0.2 /100 | #281 | Tragic 12.7% |
| Sub-Saharan Africans | 0.1 /100 | #282 | Tragic 12.7% |
| Delaware | 0.1 /100 | #283 | Tragic 12.7% |
| Immigrants | Nonimmigrants | 0.1 /100 | #284 | Tragic 12.8% |
| French | 0.1 /100 | #285 | Tragic 12.8% |
| Spanish | 0.1 /100 | #286 | Tragic 12.8% |
| Hondurans | 0.1 /100 | #287 | Tragic 12.8% |
| French Canadians | 0.1 /100 | #288 | Tragic 12.8% |
| Iroquois | 0.0 /100 | #289 | Tragic 12.9% |
| Pima | 0.0 /100 | #290 | Tragic 12.9% |
| Immigrants | Honduras | 0.0 /100 | #291 | Tragic 12.9% |
| Scotch-Irish | 0.0 /100 | #292 | Tragic 12.9% |
| Jamaicans | 0.0 /100 | #293 | Tragic 12.9% |
Demographics Similar to Vietnamese by Divorced or Separated
In terms of divorced or separated, the demographic groups most similar to Vietnamese are Immigrants from Pakistan (10.8%, a difference of 0.18%), Immigrants from Asia (10.7%, a difference of 0.26%), Immigrants from Sri Lanka (10.8%, a difference of 0.37%), Iranian (10.8%, a difference of 0.42%), and Burmese (10.7%, a difference of 0.44%).
| Demographics | Rating | Rank | Divorced or Separated |
| Immigrants | Armenia | 100.0 /100 | #15 | Exceptional 10.6% |
| Immigrants | Korea | 100.0 /100 | #16 | Exceptional 10.6% |
| Immigrants | Israel | 100.0 /100 | #17 | Exceptional 10.6% |
| Immigrants | Iran | 100.0 /100 | #18 | Exceptional 10.6% |
| Asians | 100.0 /100 | #19 | Exceptional 10.6% |
| Burmese | 100.0 /100 | #20 | Exceptional 10.7% |
| Immigrants | Asia | 100.0 /100 | #21 | Exceptional 10.7% |
| Vietnamese | 100.0 /100 | #22 | Exceptional 10.8% |
| Immigrants | Pakistan | 100.0 /100 | #23 | Exceptional 10.8% |
| Immigrants | Sri Lanka | 100.0 /100 | #24 | Exceptional 10.8% |
| Iranians | 100.0 /100 | #25 | Exceptional 10.8% |
| Immigrants | Indonesia | 100.0 /100 | #26 | Exceptional 10.9% |
| Immigrants | Bangladesh | 100.0 /100 | #27 | Exceptional 11.0% |
| Immigrants | Malaysia | 100.0 /100 | #28 | Exceptional 11.0% |
| Armenians | 100.0 /100 | #29 | Exceptional 11.0% |