Egyptian vs Immigrants from Mexico Divorced or Separated
COMPARE
Egyptian
Immigrants from Mexico
Divorced or Separated
Divorced or Separated Comparison
Egyptians
Immigrants from Mexico
11.1%
DIVORCED OR SEPARATED
100.0/ 100
METRIC RATING
33rd/ 347
METRIC RANK
12.0%
DIVORCED OR SEPARATED
53.2/ 100
METRIC RATING
172nd/ 347
METRIC RANK
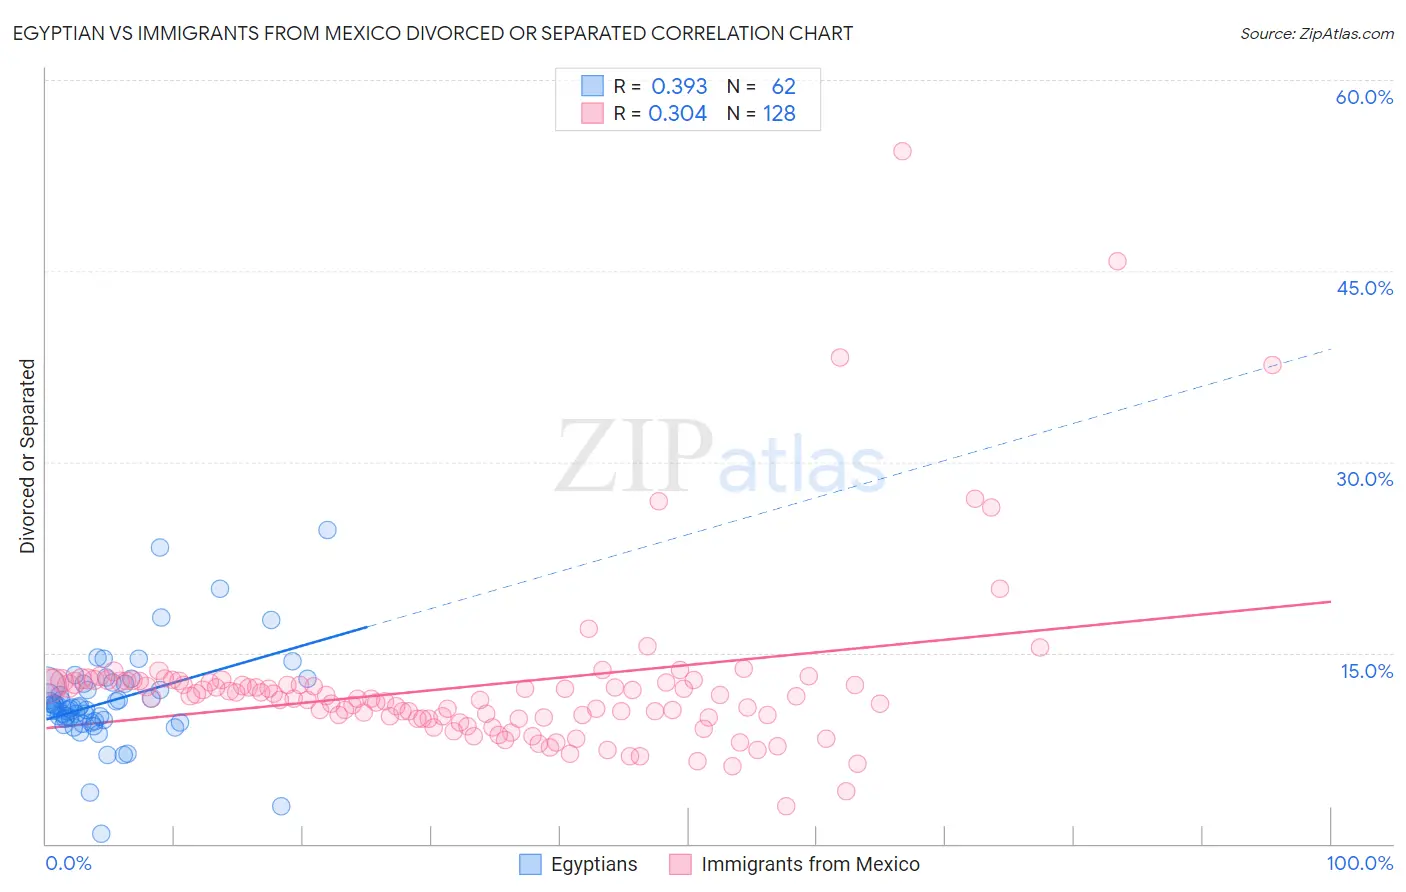
Egyptian vs Immigrants from Mexico Divorced or Separated Correlation Chart
The statistical analysis conducted on geographies consisting of 276,808,669 people shows a mild positive correlation between the proportion of Egyptians and percentage of population currently divorced or separated in the United States with a correlation coefficient (R) of 0.393 and weighted average of 11.1%. Similarly, the statistical analysis conducted on geographies consisting of 513,547,698 people shows a mild positive correlation between the proportion of Immigrants from Mexico and percentage of population currently divorced or separated in the United States with a correlation coefficient (R) of 0.304 and weighted average of 12.0%, a difference of 8.7%.
Divorced or Separated Correlation Summary
| Measurement | Egyptian | Immigrants from Mexico |
| Minimum | 0.80% | 3.0% |
| Maximum | 24.6% | 54.4% |
| Range | 23.8% | 51.4% |
| Mean | 11.2% | 12.4% |
| Median | 10.8% | 11.5% |
| Interquartile 25% (IQ1) | 9.6% | 9.9% |
| Interquartile 75% (IQ3) | 12.5% | 12.7% |
| Interquartile Range (IQR) | 2.9% | 2.8% |
| Standard Deviation (Sample) | 3.8% | 6.7% |
| Standard Deviation (Population) | 3.8% | 6.7% |
Similar Demographics by Divorced or Separated
Demographics Similar to Egyptians by Divorced or Separated
In terms of divorced or separated, the demographic groups most similar to Egyptians are Tongan (11.1%, a difference of 0.040%), Immigrants from Uzbekistan (11.1%, a difference of 0.070%), Mongolian (11.1%, a difference of 0.12%), Cambodian (11.1%, a difference of 0.15%), and Immigrants from Japan (11.1%, a difference of 0.21%).
| Demographics | Rating | Rank | Divorced or Separated |
| Immigrants | Indonesia | 100.0 /100 | #26 | Exceptional 10.9% |
| Immigrants | Bangladesh | 100.0 /100 | #27 | Exceptional 11.0% |
| Immigrants | Malaysia | 100.0 /100 | #28 | Exceptional 11.0% |
| Armenians | 100.0 /100 | #29 | Exceptional 11.0% |
| Immigrants | Ireland | 100.0 /100 | #30 | Exceptional 11.0% |
| Mongolians | 100.0 /100 | #31 | Exceptional 11.1% |
| Tongans | 100.0 /100 | #32 | Exceptional 11.1% |
| Egyptians | 100.0 /100 | #33 | Exceptional 11.1% |
| Immigrants | Uzbekistan | 100.0 /100 | #34 | Exceptional 11.1% |
| Cambodians | 100.0 /100 | #35 | Exceptional 11.1% |
| Immigrants | Japan | 100.0 /100 | #36 | Exceptional 11.1% |
| Immigrants | Lebanon | 100.0 /100 | #37 | Exceptional 11.1% |
| Immigrants | Greece | 100.0 /100 | #38 | Exceptional 11.1% |
| Immigrants | Egypt | 100.0 /100 | #39 | Exceptional 11.1% |
| Soviet Union | 100.0 /100 | #40 | Exceptional 11.1% |
Demographics Similar to Immigrants from Mexico by Divorced or Separated
In terms of divorced or separated, the demographic groups most similar to Immigrants from Mexico are Costa Rican (12.0%, a difference of 0.010%), Mexican American Indian (12.0%, a difference of 0.090%), Immigrants from Moldova (12.1%, a difference of 0.090%), Hawaiian (12.1%, a difference of 0.11%), and Immigrants from Sierra Leone (12.1%, a difference of 0.11%).
| Demographics | Rating | Rank | Divorced or Separated |
| German Russians | 61.8 /100 | #165 | Good 12.0% |
| Tohono O'odham | 60.4 /100 | #166 | Good 12.0% |
| Ethiopians | 58.5 /100 | #167 | Average 12.0% |
| Serbians | 57.1 /100 | #168 | Average 12.0% |
| Immigrants | Peru | 57.0 /100 | #169 | Average 12.0% |
| Mexican American Indians | 55.8 /100 | #170 | Average 12.0% |
| Costa Ricans | 53.3 /100 | #171 | Average 12.0% |
| Immigrants | Mexico | 53.2 /100 | #172 | Average 12.0% |
| Immigrants | Moldova | 50.4 /100 | #173 | Average 12.1% |
| Hawaiians | 50.0 /100 | #174 | Average 12.1% |
| Immigrants | Sierra Leone | 50.0 /100 | #175 | Average 12.1% |
| Pennsylvania Germans | 48.9 /100 | #176 | Average 12.1% |
| Brazilians | 47.7 /100 | #177 | Average 12.1% |
| Ghanaians | 45.9 /100 | #178 | Average 12.1% |
| Immigrants | Western Europe | 45.6 /100 | #179 | Average 12.1% |