Spanish vs Immigrants from Nicaragua Divorced or Separated
COMPARE
Spanish
Immigrants from Nicaragua
Divorced or Separated
Divorced or Separated Comparison
Spanish
Immigrants from Nicaragua
12.8%
DIVORCED OR SEPARATED
0.1/ 100
METRIC RATING
286th/ 347
METRIC RANK
13.3%
DIVORCED OR SEPARATED
0.0/ 100
METRIC RATING
313th/ 347
METRIC RANK
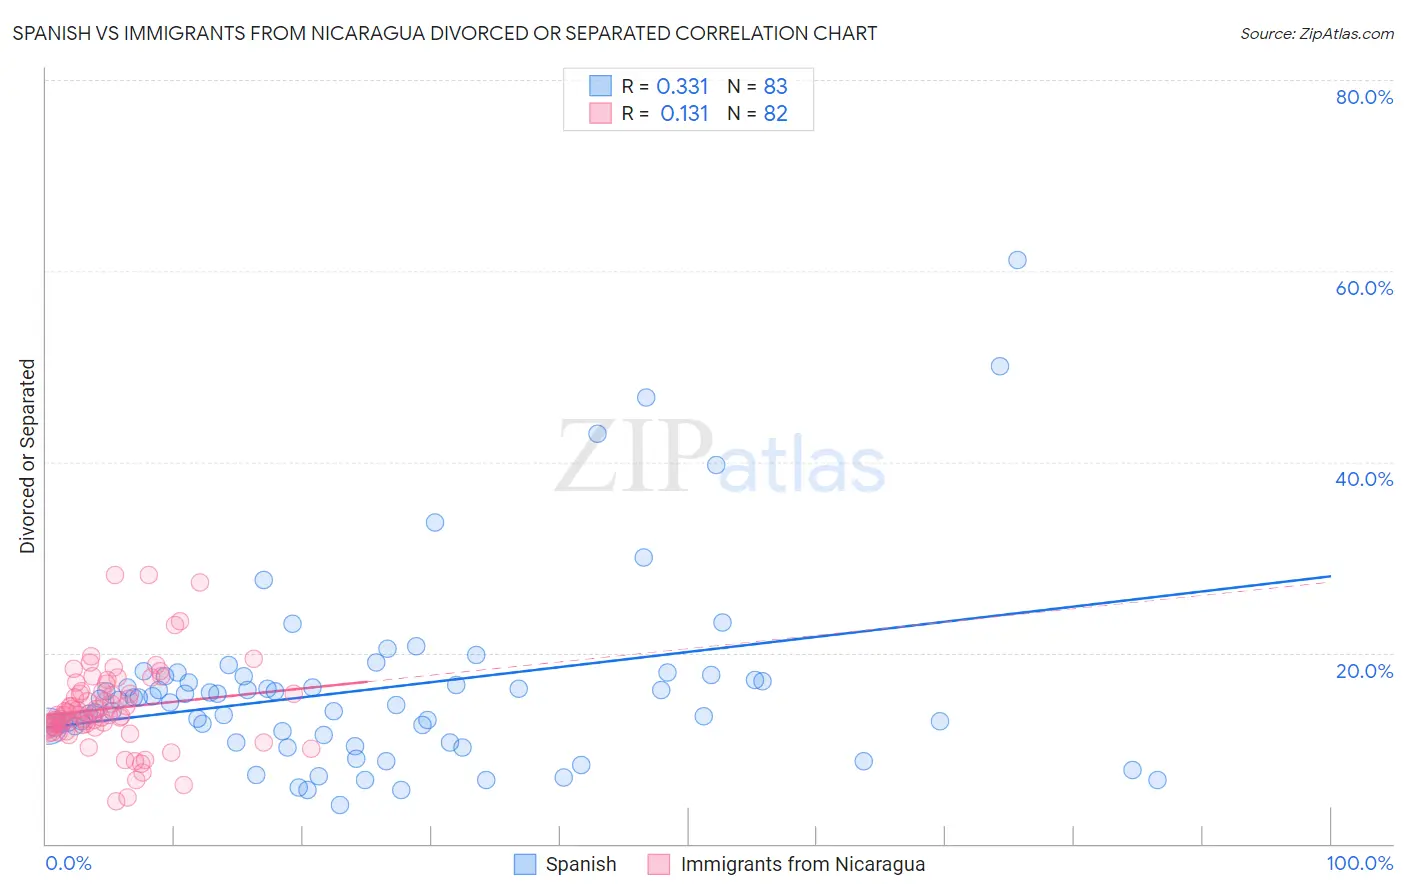
Spanish vs Immigrants from Nicaragua Divorced or Separated Correlation Chart
The statistical analysis conducted on geographies consisting of 422,013,877 people shows a mild positive correlation between the proportion of Spanish and percentage of population currently divorced or separated in the United States with a correlation coefficient (R) of 0.331 and weighted average of 12.8%. Similarly, the statistical analysis conducted on geographies consisting of 236,337,716 people shows a poor positive correlation between the proportion of Immigrants from Nicaragua and percentage of population currently divorced or separated in the United States with a correlation coefficient (R) of 0.131 and weighted average of 13.3%, a difference of 4.1%.
Divorced or Separated Correlation Summary
| Measurement | Spanish | Immigrants from Nicaragua |
| Minimum | 4.0% | 4.4% |
| Maximum | 61.2% | 28.2% |
| Range | 57.2% | 23.8% |
| Mean | 16.3% | 14.2% |
| Median | 15.1% | 13.5% |
| Interquartile 25% (IQ1) | 11.4% | 12.2% |
| Interquartile 75% (IQ3) | 17.6% | 16.0% |
| Interquartile Range (IQR) | 6.1% | 3.8% |
| Standard Deviation (Sample) | 9.8% | 4.4% |
| Standard Deviation (Population) | 9.7% | 4.4% |
Similar Demographics by Divorced or Separated
Demographics Similar to Spanish by Divorced or Separated
In terms of divorced or separated, the demographic groups most similar to Spanish are Honduran (12.8%, a difference of 0.19%), French (12.8%, a difference of 0.23%), Nonimmigrants (12.8%, a difference of 0.26%), Delaware (12.7%, a difference of 0.35%), and Subsaharan African (12.7%, a difference of 0.36%).
| Demographics | Rating | Rank | Divorced or Separated |
| Immigrants | Dominican Republic | 0.2 /100 | #279 | Tragic 12.7% |
| Immigrants | Zaire | 0.2 /100 | #280 | Tragic 12.7% |
| Pueblo | 0.2 /100 | #281 | Tragic 12.7% |
| Sub-Saharan Africans | 0.1 /100 | #282 | Tragic 12.7% |
| Delaware | 0.1 /100 | #283 | Tragic 12.7% |
| Immigrants | Nonimmigrants | 0.1 /100 | #284 | Tragic 12.8% |
| French | 0.1 /100 | #285 | Tragic 12.8% |
| Spanish | 0.1 /100 | #286 | Tragic 12.8% |
| Hondurans | 0.1 /100 | #287 | Tragic 12.8% |
| French Canadians | 0.1 /100 | #288 | Tragic 12.8% |
| Iroquois | 0.0 /100 | #289 | Tragic 12.9% |
| Pima | 0.0 /100 | #290 | Tragic 12.9% |
| Immigrants | Honduras | 0.0 /100 | #291 | Tragic 12.9% |
| Scotch-Irish | 0.0 /100 | #292 | Tragic 12.9% |
| Jamaicans | 0.0 /100 | #293 | Tragic 12.9% |
Demographics Similar to Immigrants from Nicaragua by Divorced or Separated
In terms of divorced or separated, the demographic groups most similar to Immigrants from Nicaragua are Yaqui (13.3%, a difference of 0.010%), Blackfeet (13.3%, a difference of 0.19%), Spanish American (13.3%, a difference of 0.24%), Tsimshian (13.3%, a difference of 0.27%), and Haitian (13.3%, a difference of 0.29%).
| Demographics | Rating | Rank | Divorced or Separated |
| Tlingit-Haida | 0.0 /100 | #306 | Tragic 13.2% |
| French American Indians | 0.0 /100 | #307 | Tragic 13.2% |
| Ottawa | 0.0 /100 | #308 | Tragic 13.2% |
| Americans | 0.0 /100 | #309 | Tragic 13.2% |
| Africans | 0.0 /100 | #310 | Tragic 13.2% |
| Sioux | 0.0 /100 | #311 | Tragic 13.2% |
| Blackfeet | 0.0 /100 | #312 | Tragic 13.3% |
| Immigrants | Nicaragua | 0.0 /100 | #313 | Tragic 13.3% |
| Yaqui | 0.0 /100 | #314 | Tragic 13.3% |
| Spanish Americans | 0.0 /100 | #315 | Tragic 13.3% |
| Tsimshian | 0.0 /100 | #316 | Tragic 13.3% |
| Haitians | 0.0 /100 | #317 | Tragic 13.3% |
| Cree | 0.0 /100 | #318 | Tragic 13.4% |
| Puget Sound Salish | 0.0 /100 | #319 | Tragic 13.4% |
| Cajuns | 0.0 /100 | #320 | Tragic 13.4% |