Spanish vs Afghan Divorced or Separated
COMPARE
Spanish
Afghan
Divorced or Separated
Divorced or Separated Comparison
Spanish
Afghans
12.8%
DIVORCED OR SEPARATED
0.1/ 100
METRIC RATING
286th/ 347
METRIC RANK
11.5%
DIVORCED OR SEPARATED
99.4/ 100
METRIC RATING
78th/ 347
METRIC RANK
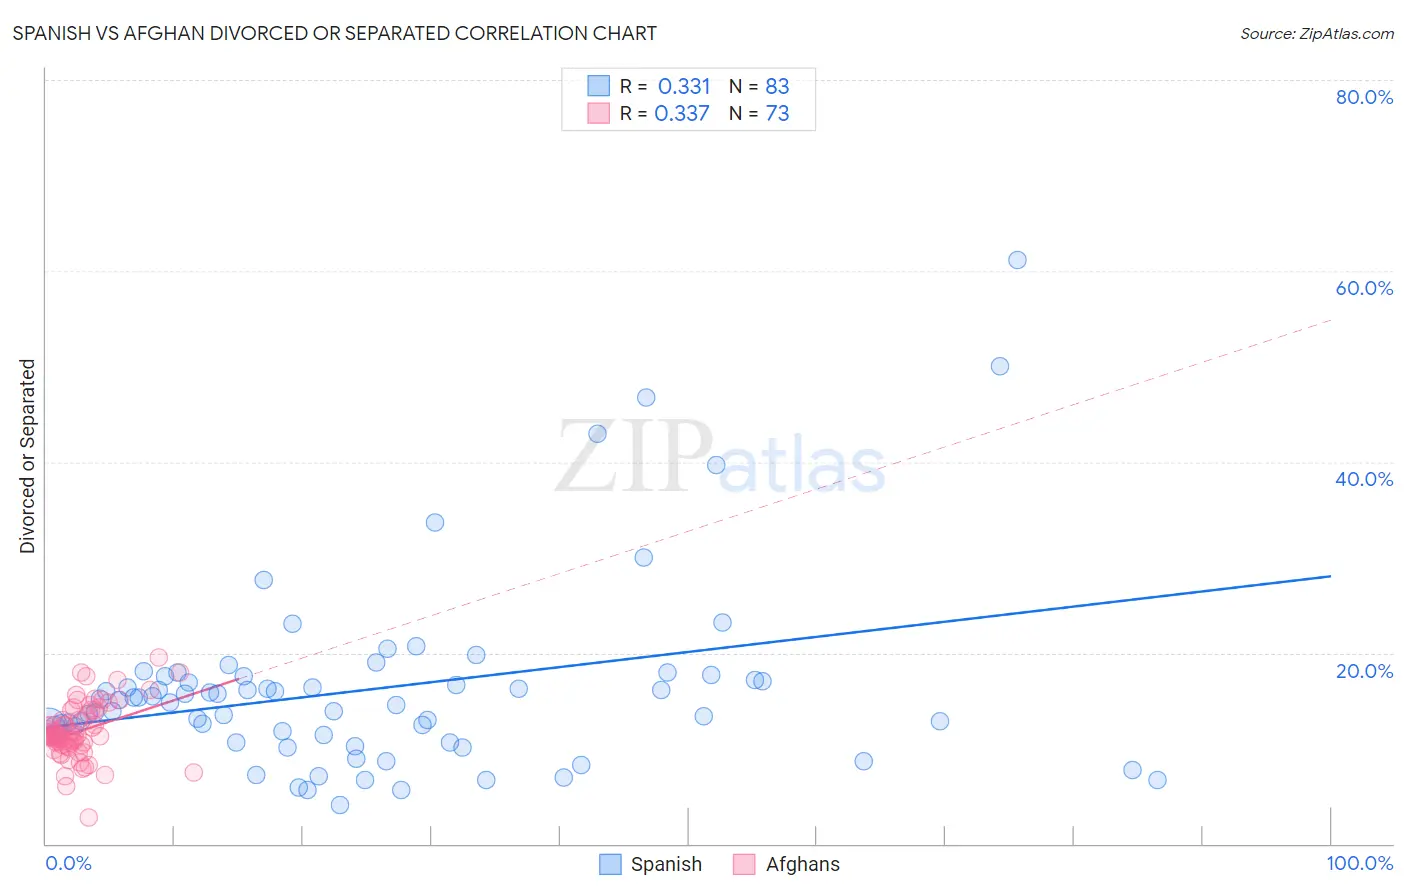
Spanish vs Afghan Divorced or Separated Correlation Chart
The statistical analysis conducted on geographies consisting of 422,013,877 people shows a mild positive correlation between the proportion of Spanish and percentage of population currently divorced or separated in the United States with a correlation coefficient (R) of 0.331 and weighted average of 12.8%. Similarly, the statistical analysis conducted on geographies consisting of 148,858,347 people shows a mild positive correlation between the proportion of Afghans and percentage of population currently divorced or separated in the United States with a correlation coefficient (R) of 0.337 and weighted average of 11.5%, a difference of 11.1%.
Divorced or Separated Correlation Summary
| Measurement | Spanish | Afghan |
| Minimum | 4.0% | 2.8% |
| Maximum | 61.2% | 19.5% |
| Range | 57.2% | 16.7% |
| Mean | 16.3% | 11.8% |
| Median | 15.1% | 11.4% |
| Interquartile 25% (IQ1) | 11.4% | 10.3% |
| Interquartile 75% (IQ3) | 17.6% | 13.7% |
| Interquartile Range (IQR) | 6.1% | 3.3% |
| Standard Deviation (Sample) | 9.8% | 2.9% |
| Standard Deviation (Population) | 9.7% | 2.9% |
Similar Demographics by Divorced or Separated
Demographics Similar to Spanish by Divorced or Separated
In terms of divorced or separated, the demographic groups most similar to Spanish are Honduran (12.8%, a difference of 0.19%), French (12.8%, a difference of 0.23%), Nonimmigrants (12.8%, a difference of 0.26%), Delaware (12.7%, a difference of 0.35%), and Subsaharan African (12.7%, a difference of 0.36%).
| Demographics | Rating | Rank | Divorced or Separated |
| Immigrants | Dominican Republic | 0.2 /100 | #279 | Tragic 12.7% |
| Immigrants | Zaire | 0.2 /100 | #280 | Tragic 12.7% |
| Pueblo | 0.2 /100 | #281 | Tragic 12.7% |
| Sub-Saharan Africans | 0.1 /100 | #282 | Tragic 12.7% |
| Delaware | 0.1 /100 | #283 | Tragic 12.7% |
| Immigrants | Nonimmigrants | 0.1 /100 | #284 | Tragic 12.8% |
| French | 0.1 /100 | #285 | Tragic 12.8% |
| Spanish | 0.1 /100 | #286 | Tragic 12.8% |
| Hondurans | 0.1 /100 | #287 | Tragic 12.8% |
| French Canadians | 0.1 /100 | #288 | Tragic 12.8% |
| Iroquois | 0.0 /100 | #289 | Tragic 12.9% |
| Pima | 0.0 /100 | #290 | Tragic 12.9% |
| Immigrants | Honduras | 0.0 /100 | #291 | Tragic 12.9% |
| Scotch-Irish | 0.0 /100 | #292 | Tragic 12.9% |
| Jamaicans | 0.0 /100 | #293 | Tragic 12.9% |
Demographics Similar to Afghans by Divorced or Separated
In terms of divorced or separated, the demographic groups most similar to Afghans are Guyanese (11.5%, a difference of 0.040%), Immigrants from Switzerland (11.5%, a difference of 0.060%), Russian (11.5%, a difference of 0.070%), Immigrants from Italy (11.5%, a difference of 0.10%), and Immigrants from Romania (11.5%, a difference of 0.15%).
| Demographics | Rating | Rank | Divorced or Separated |
| Paraguayans | 99.7 /100 | #71 | Exceptional 11.5% |
| Jordanians | 99.6 /100 | #72 | Exceptional 11.5% |
| Immigrants | North Macedonia | 99.6 /100 | #73 | Exceptional 11.5% |
| Taiwanese | 99.6 /100 | #74 | Exceptional 11.5% |
| Immigrants | Northern Africa | 99.6 /100 | #75 | Exceptional 11.5% |
| Albanians | 99.6 /100 | #76 | Exceptional 11.5% |
| Immigrants | Italy | 99.5 /100 | #77 | Exceptional 11.5% |
| Afghans | 99.4 /100 | #78 | Exceptional 11.5% |
| Guyanese | 99.4 /100 | #79 | Exceptional 11.5% |
| Immigrants | Switzerland | 99.4 /100 | #80 | Exceptional 11.5% |
| Russians | 99.4 /100 | #81 | Exceptional 11.5% |
| Immigrants | Romania | 99.3 /100 | #82 | Exceptional 11.5% |
| Immigrants | Bulgaria | 99.3 /100 | #83 | Exceptional 11.5% |
| Bulgarians | 99.3 /100 | #84 | Exceptional 11.5% |
| Immigrants | Albania | 99.3 /100 | #85 | Exceptional 11.5% |